Is It Too Late To Consider XPO (XPO) After Its Recent Share Price Surge
XPO, Inc. XPO | 210.33 | -1.10% |
- If you are wondering whether XPO at around US$179.54 is still offering value after its strong run, you are not alone. That is exactly what this article is going to unpack.
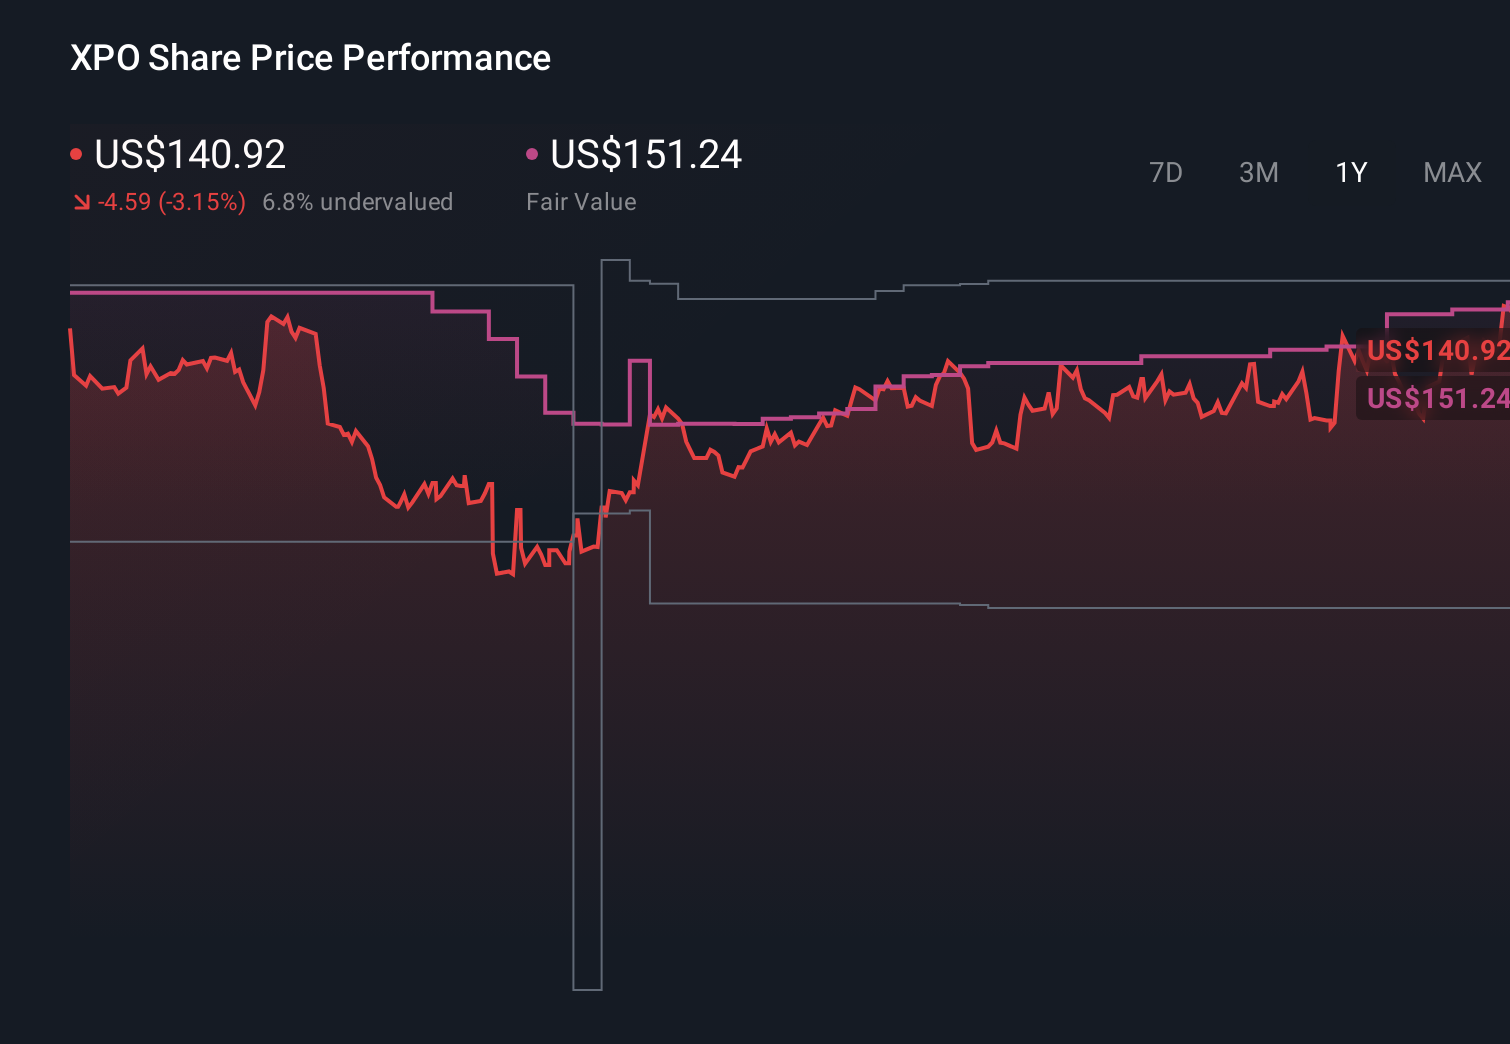
- The stock has seen sharp recent moves, with returns of 21.1% over 7 days, 23.7% over 30 days, 29.4% year to date, 31.7% over 1 year and a very large 3 year and 5 year return. This naturally raises questions about risk and upside from here.
- Recent coverage has focused on XPO's position in the transportation and logistics space, with investors watching how the company responds to freight demand trends and its competitive footing. These themes have shaped sentiment and provide important context for the price moves you are seeing now.
- Despite that performance, XPO currently scores just 1 out of 6 on our valuation checks for being undervalued. We will walk through what different valuation methods say about the stock, and then finish with a way of looking at valuation that ties the numbers back to the broader investment story.
XPO scores just 1/6 on our valuation checks. See what other red flags we found in the full valuation breakdown.
Approach 1: XPO Discounted Cash Flow (DCF) Analysis
A Discounted Cash Flow, or DCF, model takes estimates of a company’s future cash flows and discounts them back to today’s dollars, aiming to show what the business might be worth based on those projected cash flows.
For XPO, the model used here is a 2 Stage Free Cash Flow to Equity approach. The latest twelve month free cash flow is a loss of about $81.8 million. Analysts and extrapolations then project free cash flow of $946 million by 2029, with further estimates reaching about $1,381.7 million by 2035 according to the ten year projection table provided. All figures are in $ and, beyond the first few years of analyst inputs, Simply Wall St extrapolates the later years.
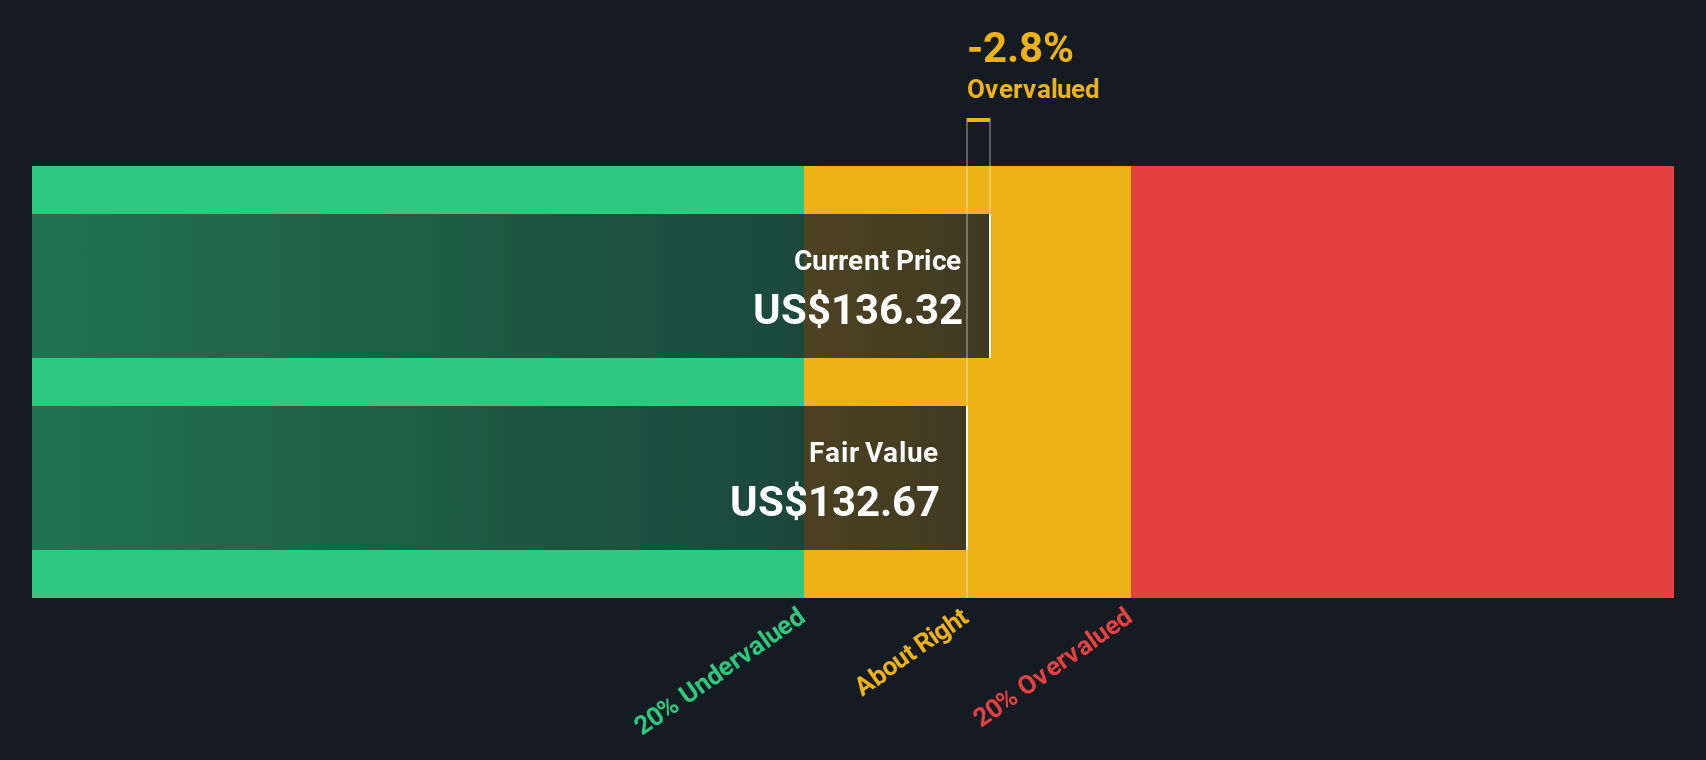
When those projected cash flows are discounted back, the model arrives at an estimated intrinsic value of about $160.31 per share. With the recent share price around $179.54, the DCF suggests XPO is roughly 12.0% overvalued on this measure.
Result: OVERVALUED
Our Discounted Cash Flow (DCF) analysis suggests XPO may be overvalued by 12.0%. Discover 865 undervalued stocks or create your own screener to find better value opportunities.
Approach 2: XPO Price vs Earnings
For a profitable company, the P/E ratio is a useful way to think about what you are paying for each dollar of earnings, because it links the share price directly to the underlying profit the business is generating today.
What counts as a “normal” P/E depends a lot on how quickly earnings are expected to grow and how risky those earnings are. Higher growth and lower perceived risk can support a higher multiple, while slower growth or higher risk usually point to a lower one.
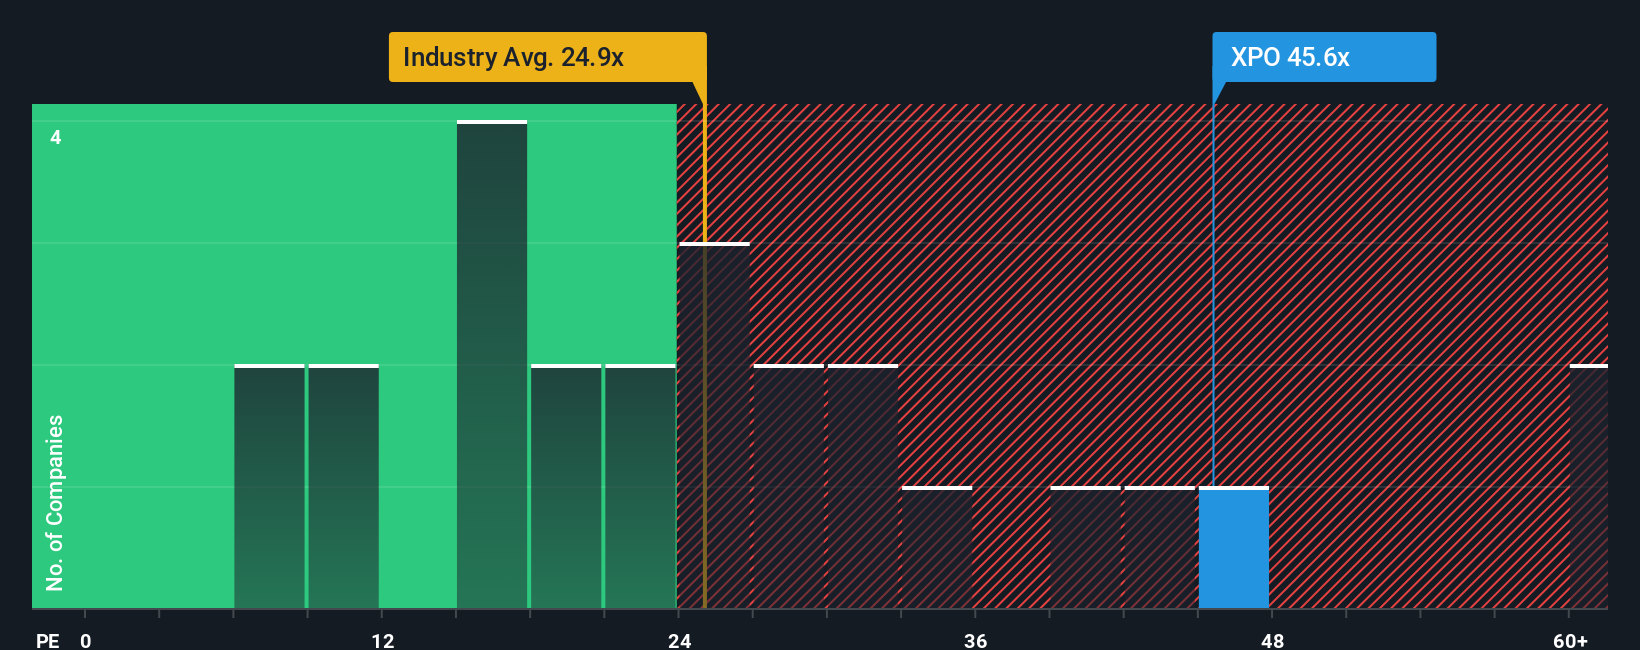
XPO is currently trading on a P/E of about 63.48x, compared with an average P/E of around 40.74x for the Transportation industry and a peer group average of roughly 67.99x. Simply Wall St also calculates a proprietary Fair Ratio of 23.40x for XPO. This Fair Ratio is designed to reflect what a more tailored P/E might look like after considering earnings growth expectations, profit margins, the company’s size, its industry and key risks, rather than relying only on broad peer or sector comparisons.
Putting those together, XPO’s current P/E of 63.48x is well above the Fair Ratio of 23.40x, suggesting the shares are trading at a premium to what this framework indicates.
Result: OVERVALUED
P/E ratios tell one story, but what if the real opportunity lies elsewhere? Discover 1433 companies where insiders are betting big on explosive growth.
Upgrade Your Decision Making: Choose your XPO Narrative
Earlier we mentioned that there is an even better way to understand valuation, so let us introduce you to Narratives, a simple framework that lets you attach your own story about XPO to the numbers like fair value, future revenue, earnings and margins you expect.
A Narrative links what you believe about the business to a financial forecast, and then turns that forecast into a fair value that you can compare with today’s share price.
On Simply Wall St, within the Community page that is used by millions of investors, Narratives are an accessible tool you can use to set your assumptions, see the implied fair value and quickly check whether that sits above or below the current market price when you are thinking about buying or selling.
Because Narratives update automatically when new information such as news or earnings is added to the platform, your story about XPO stays aligned with the latest data instead of going stale, and different investors can hold very different views on XPO’s fair value even while using the same Narrative tool.
Do you think there's more to the story for XPO? Head over to our Community to see what others are saying!
This article by Simply Wall St is general in nature. We provide commentary based on historical data and analyst forecasts only using an unbiased methodology and our articles are not intended to be financial advice. It does not constitute a recommendation to buy or sell any stock, and does not take account of your objectives, or your financial situation. We aim to bring you long-term focused analysis driven by fundamental data. Note that our analysis may not factor in the latest price-sensitive company announcements or qualitative material. Simply Wall St has no position in any stocks mentioned.