Is It Too Late To Reassess RB Global (RBA) After Its Recent Share Price Surge?
RB Global, Inc. RBA | 0.00 |
- Investors may be wondering if RB Global at around US$103 a share is still offering value or if most of the upside is already priced in.
- The stock has been fairly steady year to date, with a 0.1% return. However, that headline number masks a 5.8% gain over the past month, a small 0.8% slip in the last week, and a return of 97.8% over three years and 85.2% over five years.
- Recent coverage has focused on RB Global's role in the Commercial Services sector and how investors are reacting to its position and deal making in that space. This context helps explain why the share price has shown both long term strength and short term fluctuations as expectations are reassessed.
- Simply Wall St currently gives RB Global a valuation score of 3 out of 6. The rest of this article unpacks what different valuation methods suggest about that score and highlights a more complete way of thinking about value at the end.
Approach 1: RB Global Discounted Cash Flow (DCF) Analysis
A Discounted Cash Flow model takes projected future cash flows, then discounts them back to today to estimate what the business might be worth in present dollar terms. It focuses on cash that could, in theory, be returned to shareholders over time.
For RB Global, the model used is a 2 Stage Free Cash Flow to Equity approach based on cash flow projections. The latest twelve month Free Cash Flow is about $676.9 million. Analyst estimates and extrapolations point to Free Cash Flow of $1,517.4 million in 2030, with a set of annual projections between 2026 and 2035 that gradually step up over time as shown in the Simply Wall St model.
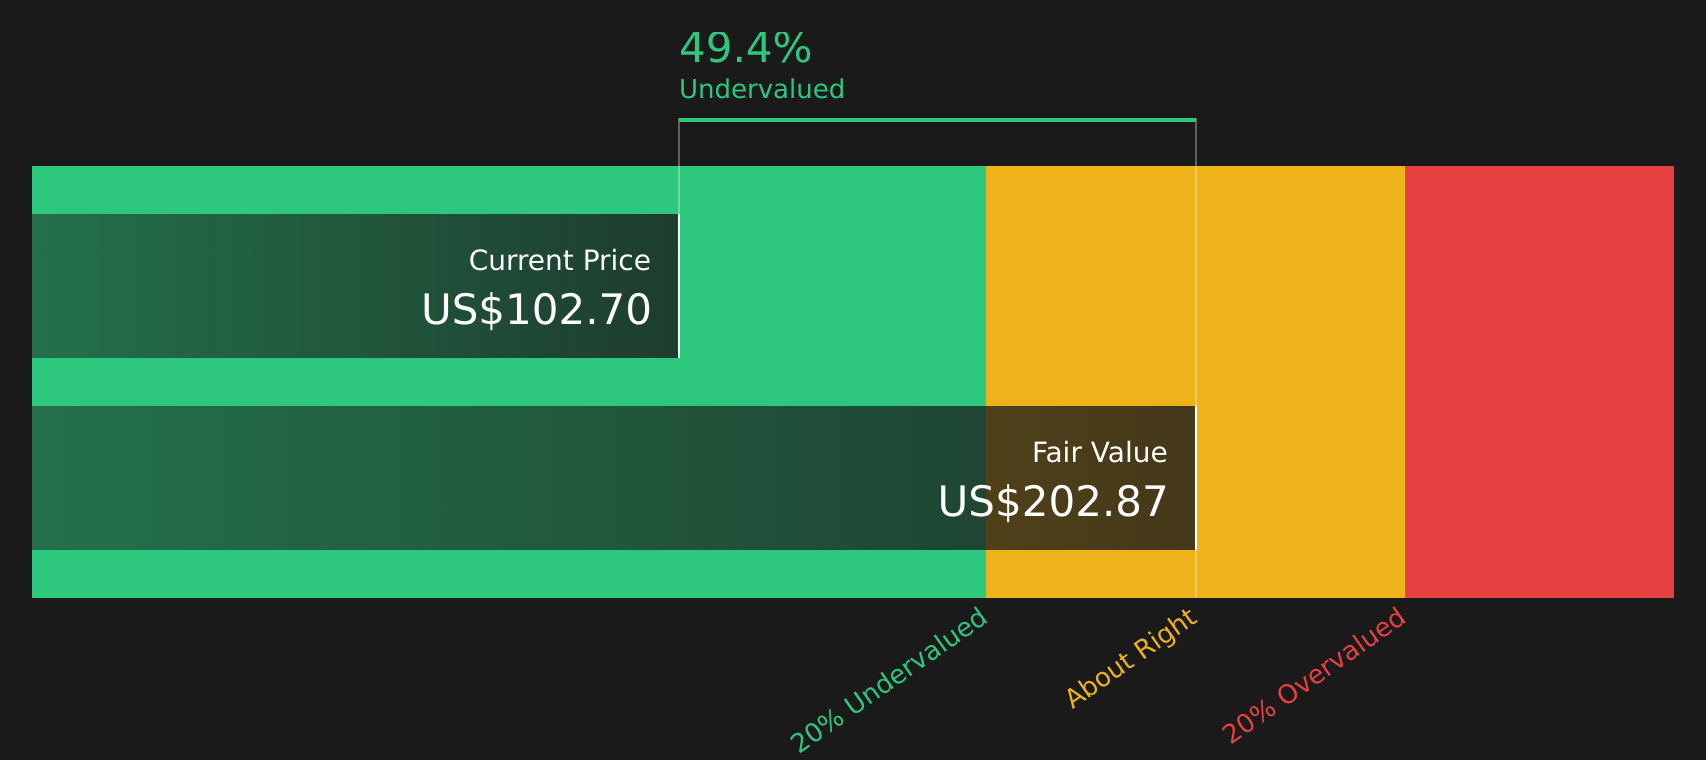
Discounting these projected cash flows back to today gives an estimated intrinsic value of about $202.50 per share. Compared with the current share price of around $103, the DCF output from this model suggests the stock is trading at a discount to that intrinsic value estimate.
Result: Potential undervaluation according to this DCF model
Our Discounted Cash Flow (DCF) analysis suggests RB Global is undervalued by 48.9%. Track this in your watchlist or portfolio, or discover 51 more high quality undervalued stocks.
Approach 2: RB Global Price vs Earnings (P/E)
For profitable companies, the P/E ratio is a straightforward way to relate what you are paying for each share to the earnings that support that price. It helps you see how many dollars of share price equate to one dollar of earnings.
What counts as a “normal” P/E depends on how quickly earnings are expected to grow and how risky those earnings are. Higher expected growth or lower perceived risk can justify a higher P/E, while slower growth or higher risk usually calls for a lower one.
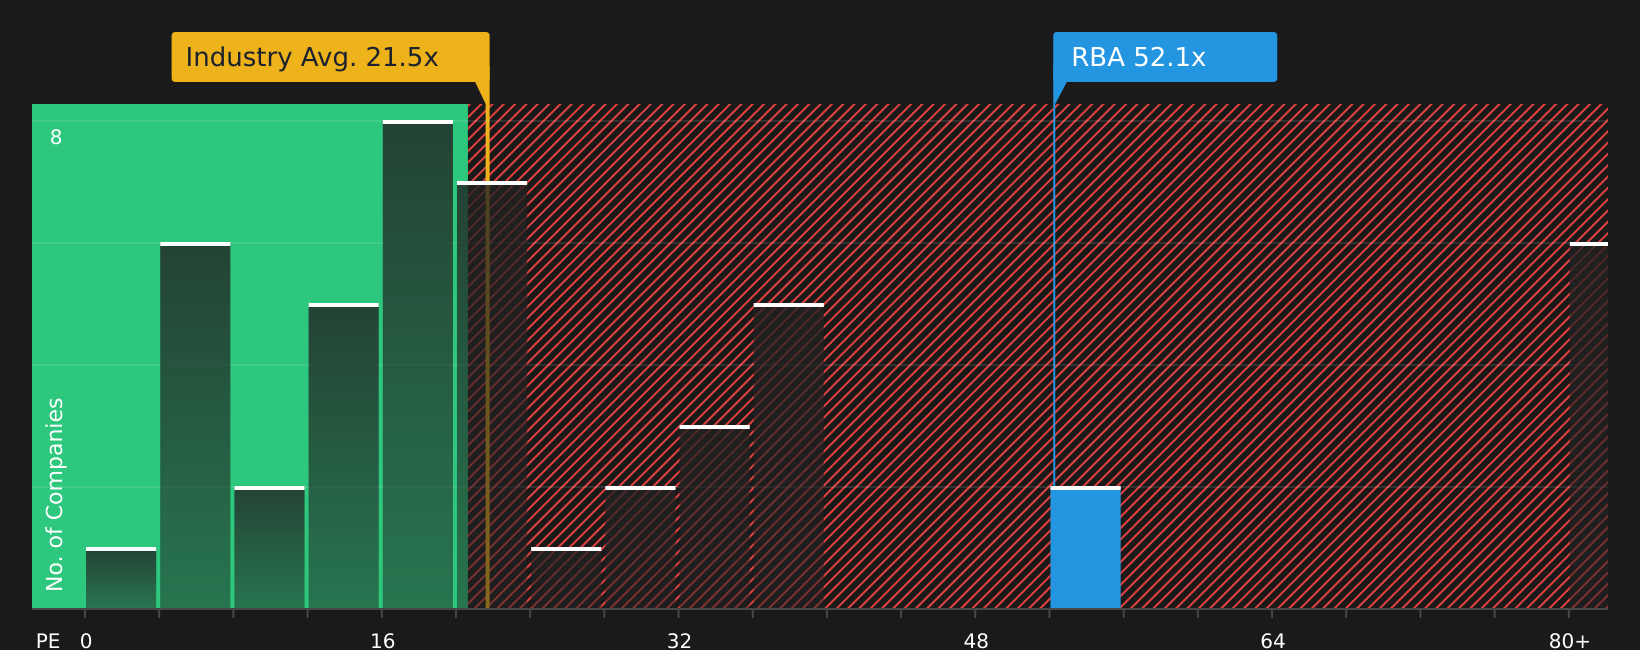
RB Global currently trades on a P/E of 47.80x. That is above the Commercial Services industry average of 22.30x and also above the peer average of 31.89x. Simply Wall St’s Fair Ratio for RB Global is 30.67x. The Fair Ratio is a proprietary estimate of what the P/E might be based on factors such as earnings growth, profit margins, industry, market cap and company specific risks.
Because the Fair Ratio adjusts for these fundamentals, it can give a more tailored view than a simple comparison with industry or peers. With the current P/E of 47.80x sitting well above the Fair Ratio of 30.67x, the stock appears expensive on this metric.
Result: OVERVALUED
P/E ratios tell one story, but what if the real opportunity lies elsewhere? Start investing in legacies, not executives. Discover our 18 top founder-led companies.
Upgrade Your Decision Making: Choose your RB Global Narrative
Earlier it was mentioned that there is an even better way to understand valuation. Narratives take the next step by letting you attach a clear story about RB Global to concrete numbers like your own fair value, revenue, earnings and margin assumptions, so that the company’s story links directly to a forecast and then to a fair value that can be compared with today’s share price to help you judge whether it looks high or low for your view.
On Simply Wall St’s Community page, Narratives are designed as an easy tool that updates automatically when new earnings, news or analyst inputs are added. You can see how different views stack up. For example, one RB Global Narrative might align with a higher fair value of about US$146.00, while another might sit closer to roughly US$100.93. By comparing each of those to the current price, you can decide which story you agree with most and what that implies for your own trading decisions.
For RB Global however we'll make it really easy for you with previews of two leading RB Global Narratives:
Fair value in this bullish narrative: US$146.00 per share
Implied discount to this fair value vs last close of US$103.43: about 29%
Revenue growth assumption: 10.27% a year
- Expects digitization, global expansion and cross border integrations to lift transaction volumes, market share and margins.
- Builds in a higher earnings path, with revenue growth of about 10.3% a year, a move in profit margin from 8.3% to 15.3% and earnings of US$944.2m by 2029.
- Assumes the stock trades on a future P/E of 35.9x, which supports a fair value of US$146.00 when combined with those growth and margin expectations.
Fair value in this bearish narrative: US$100.93 per share
Implied premium to this fair value vs last close of US$103.43: about 2%
Revenue growth assumption: 10.08% a year
- Highlights pressure from digital only competitors, decarbonization and automation, which could weigh on equipment volumes, fees and long term margins.
- Assumes revenue growth of about 10.1% a year, profit margin moving from 8.3% to 15.2% and earnings of US$930.8m by 2029 under a more cautious view.
- Uses a future P/E of 25.2x to arrive at a fair value of US$100.93, only slightly above the current share price, which implies limited upside in this scenario.
If you want to see the full reasoning, stress test the assumptions and check how other investors are framing RB Global, the easiest next step is to read the narratives in full and compare them with your own expectations for the business. See what the community is saying about RB Global
Do you think there's more to the story for RB Global? Head over to our Community to see what others are saying!

This article by Simply Wall St is general in nature. We provide commentary based on historical data and analyst forecasts only using an unbiased methodology and our articles are not intended to be financial advice. It does not constitute a recommendation to buy or sell any stock, and does not take account of your objectives, or your financial situation. We aim to bring you long-term focused analysis driven by fundamental data. Note that our analysis may not factor in the latest price-sensitive company announcements or qualitative material. Simply Wall St has no position in any stocks mentioned.