Is It Too Late To Reconsider Moody's (MCO) After Mixed Returns And Ratings Headlines?
Moody's Corporation MCO | 0.00 |
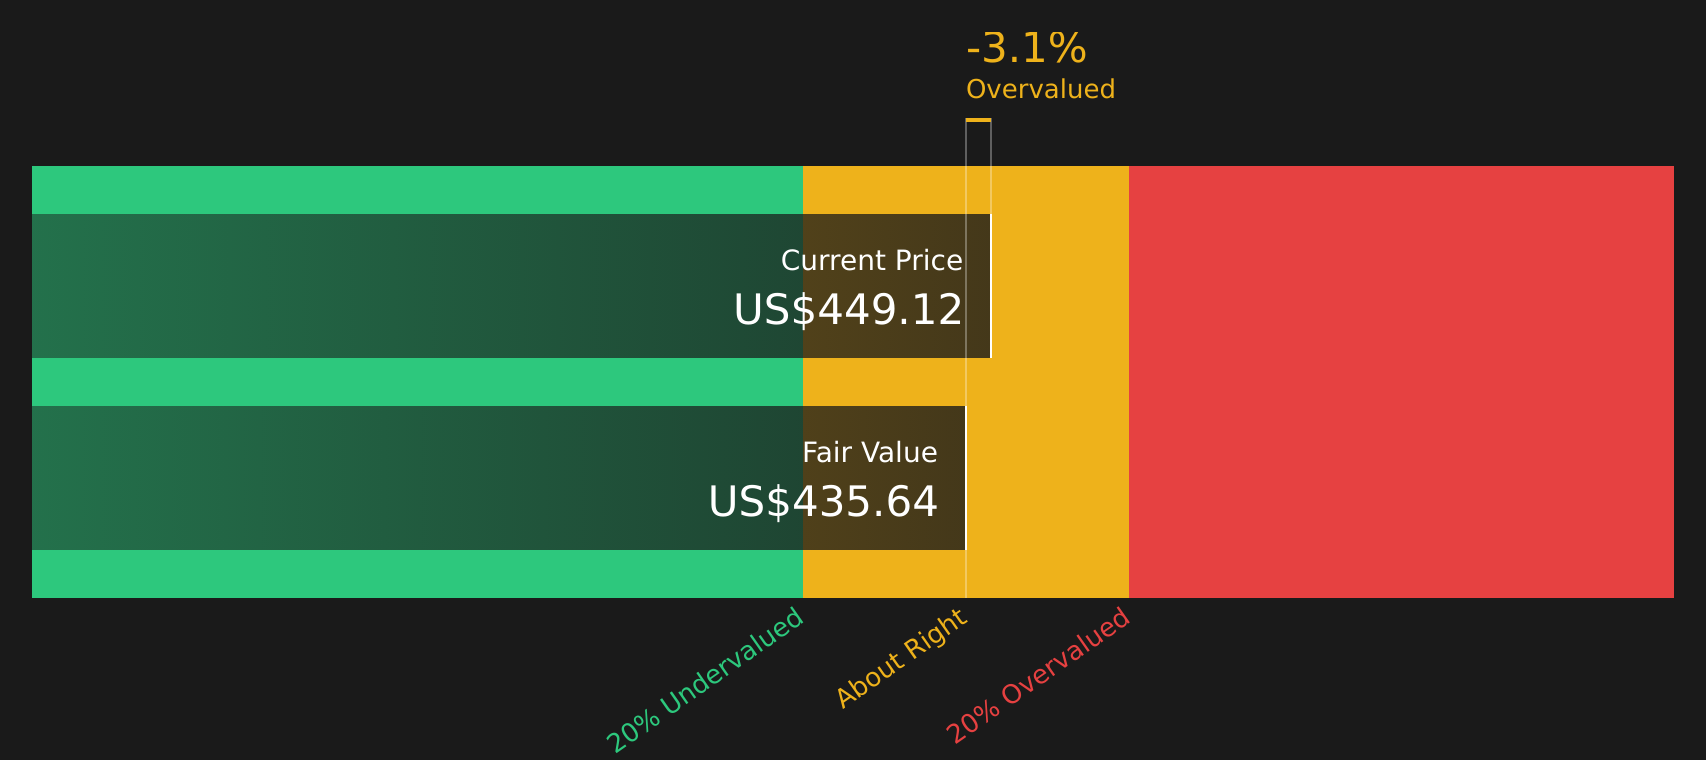
With Moody's stock at US$444.27, you might be wondering whether the current price still reflects a fair deal or if expectations have already been priced in.
Recent returns have been mixed, with the stock up 1.4% over the last week, down 3.4% over the past month, down 11.0% year to date, and down 5.2% over the last year, while still showing a 47.3% gain over three years and 39.9% over five years.
Recent news coverage has focused on Moody's role in credit ratings, analytics, and broader financial markets. This often comes into focus when funding conditions, issuance volumes, or credit trends are in the spotlight. These developments help frame how investors think about the stock's risk profile and earnings potential, which can influence sentiment around the current share price.
Right now, Moody's has a valuation score of 2 out of 6, based on how often it screens as undervalued across several standard checks. The rest of this article will walk through those methods before finishing with an approach that can give you a more complete way to think about what the stock might be worth.
Moody's scores just 2/6 on our valuation checks. See what other red flags we found in the full valuation breakdown.
Approach 1: Moody's Excess Returns Analysis
The Excess Returns model looks at how much profit Moody's is estimated to generate above the return that shareholders typically require, then capitalizes those surplus earnings into an intrinsic value per share.
For Moody's, the starting point is an estimated Book Value of $17.14 per share and a Stable EPS of $20.12 per share, based on weighted future Return on Equity estimates from 7 analysts. The Average Return on Equity is 76.99%, which sits well above the model's Cost of Equity of $2.07 per share. This gap produces an estimated Excess Return of $18.05 per share.
The model also uses a Stable Book Value of $26.13 per share, sourced from weighted future Book Value estimates from 5 analysts, to reflect a steady state level of capital that can keep earning those excess returns over time. Combining these inputs, the Excess Returns framework produces an intrinsic value of about $436.60 per share.
Against the current share price of US$444.27, this implies Moody's stock is about 1.8% overvalued, which is a very small gap.
Result: ABOUT RIGHT
Moody's is fairly valued according to our Excess Returns, but this can change at a moment's notice. Track the value in your watchlist or portfolio and be alerted on when to act.
Approach 2: Moody's Price vs Earnings
For a profitable company like Moody's, the P/E ratio is a useful way to think about value because it ties the share price directly to the earnings that support it. Investors usually accept a higher or lower P/E depending on what they expect for future growth and how much risk they see in those earnings.
Moody's currently trades at about 31.1x earnings. That sits below the wider Capital Markets industry average of roughly 40.1x, but above the peer group average of about 24.8x. So, compared only with peers, the stock looks more expensive, while compared with the broader industry it looks cheaper.
Simply Wall St’s Fair Ratio for Moody's is 17.1x. This is a proprietary estimate of what the P/E might be given factors such as the company’s earnings profile, its industry, profit margins, market value and specific risks. Using a Fair Ratio can be more informative than a simple peer or industry comparison because it adjusts for these company specific characteristics rather than assuming all Capital Markets stocks deserve similar multiples. Compared with the current P/E of 31.1x, the Fair Ratio suggests the stock is trading on a richer multiple than those fundamentals imply.
Result: OVERVALUED

P/E ratios tell one story, but what if the real opportunity lies elsewhere? Start investing in legacies, not executives. Discover our 20 top founder-led companies.
Upgrade Your Decision Making: Choose your Moody's Narrative
Earlier it was mentioned that there is an even better way to understand valuation. Narratives on Simply Wall St’s Community page give you a simple way to attach your own story about Moody's to the numbers by linking a view on its business, a forecast for revenue, earnings and margins, and then a Fair Value that you can compare with today’s price to help decide whether to buy, hold, or sell. That Fair Value updates as new news or earnings are released. One investor might build a cautious Moody's Narrative that anchors on a Fair Value of about US$159 per share, while another builds a more optimistic one at about US$551 per share. You can see both side by side to judge which story and set of assumptions fits your view best.
For Moody's, however, we will make it really easy for you with previews of two leading Moody's Narratives:
Fair value: US$551.41
Gap to this fair value: about 19.4% below that estimate
Revenue growth assumption: 6.55%
- Sees Moody's as a wide moat business with high operating margins and returns on capital comfortably above its estimated cost of capital.
- Uses several valuation tools together, including DCF, earnings growth and historical multiples, to build a blended fair value estimate.
- Views the stock as supported by strong fundamentals, while keeping an eye on risks from AI and potential shifts in global credit rating demand.
Fair value: US$159.00
Gap to this fair value: about 179.4% above that estimate
Revenue growth assumption: decline of 13.76%
- Frames Moody's as a powerful ratings and analytics franchise with regulatory protections and a long operating history.
- Highlights the importance of the ratings oligopoly, recurring analytics revenue and how deeply embedded Moody's tools are in financial workflows.
- Questions whether current pricing already reflects an optimistic view of the business and future cash flows, using a required return hurdle and exit multiple to anchor value.
If you want to go beyond these previews and see how different investors connect their stories, assumptions and fair values, See what the community is saying about Moody's.
Do you think there's more to the story for Moody's? Head over to our Community to see what others are saying!

This article by Simply Wall St is general in nature. We provide commentary based on historical data and analyst forecasts only using an unbiased methodology and our articles are not intended to be financial advice. It does not constitute a recommendation to buy or sell any stock, and does not take account of your objectives, or your financial situation. We aim to bring you long-term focused analysis driven by fundamental data. Note that our analysis may not factor in the latest price-sensitive company announcements or qualitative material. Simply Wall St has no position in any stocks mentioned.