

Is Lam Research (LRCX) Pricing Reflect Long-Term Prospects After Recent Share Price Surge
Lam Research Corporation LRCX | 0.00 |
- If you are wondering whether Lam Research's share price still lines up with its fundamentals, the starting point is to understand what the recent market action might be implying about value and risk.
- Over the most recent periods, the stock has posted returns of 10.4% over 7 days, 10.7% over 30 days, 19.2% year to date, 257.3% over 1 year and 347.6% over 3 years, with a 5 year return of 257.9%.
- Recent headlines around Lam Research have kept attention on the stock, with investors closely watching how the company fits into broader themes in semiconductors and capital equipment. This context helps explain why the share price has been so active across multiple time frames.
- At the same time, Lam Research holds a valuation score of 2 out of 6. The next sections will walk through traditional valuation approaches and then finish with a way of thinking about valuation that goes a step further.
Lam Research scores just 2/6 on our valuation checks. See what other red flags we found in the full valuation breakdown.
Approach 1: Lam Research Discounted Cash Flow (DCF) Analysis
A Discounted Cash Flow, or DCF, model estimates what a company could be worth by projecting future cash flows and then discounting those back to today using a required rate of return.
For Lam Research, the model uses a 2 Stage Free Cash Flow to Equity approach. The latest twelve month free cash flow is about $6.40b. Analysts provide detailed free cash flow estimates for the earlier years, and Simply Wall St extrapolates further out. By 2030, projected free cash flow is $11.69b, with intermediate annual projections between 2026 and 2035 ranging from about $5.62b to $15.21b before discounting, based on a mix of analyst estimates and modelled growth rates.
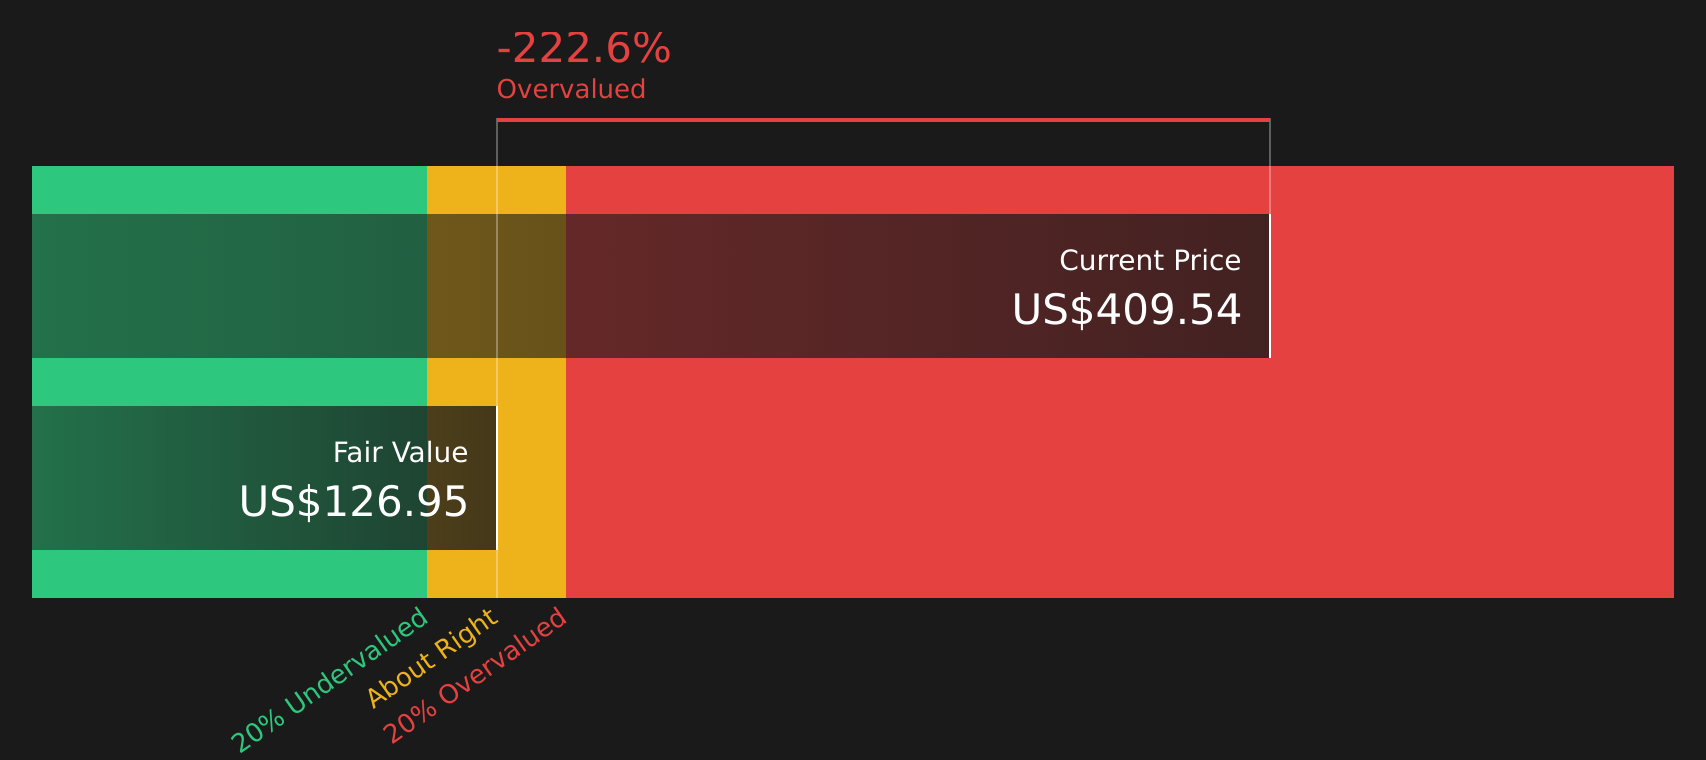
After discounting those future cash flows back to today, the model arrives at an estimated intrinsic value of $114.63 per share. Compared with the current share price, this implies the stock is 92.5% overvalued according to this specific DCF framework.
Result: OVERVALUED
Our Discounted Cash Flow (DCF) analysis suggests Lam Research may be overvalued by 92.5%. Discover 62 high quality undervalued stocks or create your own screener to find better value opportunities.
Approach 2: Lam Research Price vs Earnings
For profitable companies like Lam Research, the P/E ratio is a straightforward way to connect what you pay for each share with the earnings that support it. It gives you a simple “price tag” on current profits. What counts as a normal or fair P/E ratio usually reflects how the market views a company’s growth outlook and risk profile. Higher expected growth and lower perceived risk tend to support a higher P/E, while slower growth or higher risk often point to a lower P/E.
Lam Research currently trades on a P/E of 44.35x. That is above the broader Semiconductor industry average of 36.26x, yet below the peer group average of 51.28x. Simply Wall St’s Fair Ratio for Lam Research is 40.06x. This Fair Ratio is a proprietary estimate of the P/E that could be justified for the company, based on factors such as its earnings growth characteristics, profit margins, industry, market cap and specific risks. It offers a more tailored yardstick than raw peer or industry comparisons, which can miss important differences between companies.
With the current P/E of 44.35x sitting above the Fair Ratio of 40.06x, the shares screen as overvalued on this multiple based approach.
Result: OVERVALUED

P/E ratios tell one story, but what if the real opportunity lies elsewhere? Start investing in legacies, not executives. Discover our 20 top founder-led companies.
Upgrade Your Decision Making: Choose your Lam Research Narrative
Earlier it was mentioned that there is an even better way to understand valuation. Narratives on Simply Wall St let you attach a clear story to your numbers by linking your view on Lam Research's future revenue, earnings and margins to a forecast and Fair Value, then comparing that Fair Value with the current price to help guide your buy or sell decisions. This all takes place within an easy tool on the Community page that automatically refreshes when new earnings, news or guidance arrive. For example, a bullish Lam Narrative might lean toward a Fair Value around US$325.00 with assumptions of faster growth and higher margins, while a more cautious Lam Narrative might point closer to US$115.00 with assumptions of slower growth and lower margins. Your task is to choose the narrative that best matches what you believe is realistic.
For Lam Research, here are previews of two leading Lam Research Narratives to make comparison easier:
Start with the bullish case if you think the current enthusiasm around AI and memory spending is justified and sustainable, then balance it against a more cautious view that stresses export rules, competition and margin pressure.
Fair Value: about US$274.90 per share
Implied valuation gap vs last close of US$220.65: roughly 19.7% below this narrative’s fair value
Revenue growth assumption: 16.49% a year
- AI workloads, advanced chip architectures and supportive government incentives are expected to support wafer fab equipment spending and Lam Research's order visibility.
- Process leadership in areas such as ALD Moly and advanced packaging, together with operational improvements and services revenue, is aimed at supporting margins and earnings stability.
- Analysts using this view see Lam Research as fairly close to their consensus price target, so the case rests on revenue reaching about US$23.6b and earnings of US$6.7b by 2028 on a P/E of 26.3x.
Fair Value: about US$115.00 per share
Implied valuation gap vs last close of US$220.65: roughly 91.9% above this narrative’s fair value
Revenue growth assumption: 7.58% a year
- Tighter export controls, heavy exposure to China and rising local competitors are highlighted as key risks to Lam Research's revenue and pricing power over time.
- High R&D intensity, potential commoditisation of equipment and sustainability compliance costs are expected to weigh on margins and free cash flow quality.
- Bearish analysts in this camp anchor on a lower price target around US$81.24 that assumes slower revenue growth to about US$21.4b by 2028 and a lower P/E of 22.9x.
Both narratives use the same company, the same set of facts and similar tools, but they arrive at very different fair values. The key step is to decide which set of assumptions about growth, margins and regulation feels more realistic to you and then size any position accordingly.
Once you have a view, you can stress test it against other Community Narratives and valuation models to see how sensitive your thesis is to earnings, discount rates or changes in wafer fab equipment budgets, and adjust as new information comes through.
Do you think there's more to the story for Lam Research? Head over to our Community to see what others are saying!

This article by Simply Wall St is general in nature. We provide commentary based on historical data and analyst forecasts only using an unbiased methodology and our articles are not intended to be financial advice. It does not constitute a recommendation to buy or sell any stock, and does not take account of your objectives, or your financial situation. We aim to bring you long-term focused analysis driven by fundamental data. Note that our analysis may not factor in the latest price-sensitive company announcements or qualitative material. Simply Wall St has no position in any stocks mentioned.