Is Lennox International (LII) Still Attractive After Recent Share Price Stagnation?
Lennox International Inc. LII | 0.00 |
- If you are wondering whether Lennox International at around US$518 per share is still good value or already pricing in a lot of optimism, the key is to look closely at what different valuation methods are saying.
- The stock is up 4.2% over the last week, roughly flat over the past month with a 0.8% decline, up 3.8% year to date, yet down 4.9% over the past year, while still showing a 75.0% gain over three years and 62.6% over five years.
- Recent coverage has focused on how the stock's longer term gains sit alongside a softer one year return. This has led some investors to reassess whether expectations have caught up with the share price. Other commentary has pointed to Lennox International's position within the capital goods sector as a key reference point for how much risk and opportunity might already be priced in.
- Right now Lennox International scores 3 out of 6 on our valuation checks, with a value score of 3. Next up is a look at what different valuation approaches say about that score and, later in the article, a way to think about valuation that goes beyond any single model.
Approach 1: Lennox International Discounted Cash Flow (DCF) Analysis
A Discounted Cash Flow model estimates what a stock could be worth by projecting future cash flows and then discounting them back into today’s dollars using a required return. It is essentially asking what all those future cash flows are worth right now.
For Lennox International, the model uses a 2 Stage Free Cash Flow to Equity approach. The latest twelve month free cash flow is about $623.3 million. Analyst inputs and subsequent extrapolations feed into ten year projections that reach a forecast free cash flow of $1,306.0 million in 2030, with intermediate years such as 2026 and 2027 at $821.7 million and $894.2 million respectively. Simply Wall St extends analyst coverage beyond the early years to build out the full ten year path.
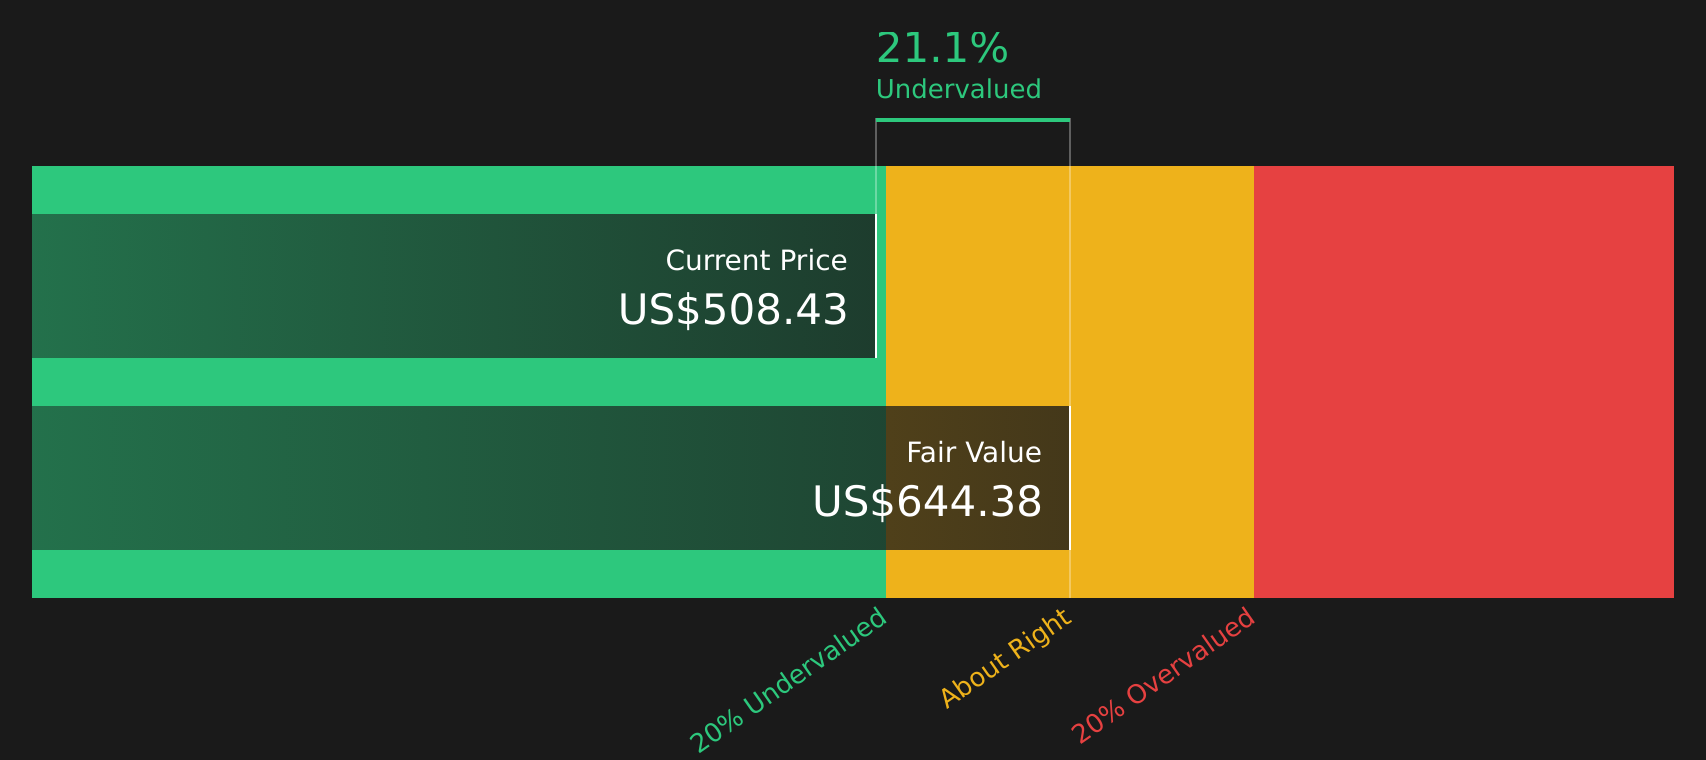
Discounting those projected cash flows back to today gives an estimated intrinsic value of about $631.97 per share. Compared with the current share price of roughly $518, the DCF implies the stock is about 18.0% below this estimate. This suggests that, on this model alone, Lennox International may be trading at a discount.
Result: UNDERVALUED
Our Discounted Cash Flow (DCF) analysis suggests Lennox International is undervalued by 18.0%. Track this in your watchlist or portfolio, or discover 45 more high quality undervalued stocks.
Approach 2: Lennox International Price vs Earnings
For a profitable company like Lennox International, the P/E ratio is a useful yardstick because it links what you pay for each share directly to the earnings that the business is currently generating. Investors generally accept paying a higher P/E when they expect stronger earnings growth or see the business as lower risk, while slower growth or higher risk usually lines up with a lower, more cautious P/E.
Lennox International is trading on a P/E of 22.7x. That sits above the Building industry average P/E of about 20.2x, yet below the peer group average of 46.0x. Simply Wall St also calculates a Fair Ratio of 28.0x for Lennox International. This Fair Ratio is a proprietary estimate of what the P/E might reasonably be, given factors such as earnings growth, profit margins, company size, industry and specific risk profile.
Compared with a simple peer or industry comparison, the Fair Ratio is more tailored to Lennox International because it blends these company specific inputs instead of assuming that all stocks deserve the same multiple. With the current P/E of 22.7x sitting below the Fair Ratio of 28.0x, this approach points to Lennox International trading at a discount on its earnings.
Result: UNDERVALUED

P/E ratios tell one story, but what if the real opportunity lies elsewhere? Start investing in legacies, not executives. Discover our 20 top founder-led companies.
Upgrade Your Decision Making: Choose your Lennox International Narrative
Earlier it was mentioned that there is an even better way to think about valuation, and this is where Narratives come in, letting you attach a clear story about Lennox International to the numbers you see, so your assumptions about fair value, future revenue, earnings and margins are all tied to a specific view of how the business might develop.
On Simply Wall St’s Community page, Narratives give you a straightforward tool to connect that story to a financial forecast and then to a fair value, so you can compare your view with others and see how different revenue, margin and P/E assumptions translate into a value per share.
Those Narratives then help you decide what to do by setting a Fair Value and lining it up against the current price. This makes it easier to judge whether the stock looks expensive or cheap according to your own assumptions rather than relying only on standard ratios.
Narratives are also refreshed when new information comes in, such as Lennox International’s guidance or M&A plans. You can see how a more optimistic Fair Value of US$650 and a more cautious Fair Value of US$450 sit alongside the consensus view, then decide which story and valuation best matches your expectations and risk comfort.
For Lennox International however, we will make it really easy for you with previews of two leading Lennox International Narratives:
Fair Value: US$650.00
Gap to this Fair Value vs last close: about 20.3% below that fair value
Revenue growth assumption: 10.54% a year
- Focuses on higher cash generation from a shift to R 454B products, digital tools, and an expanded distribution network. Together, these are expected to support future buybacks and M&A activity.
- Assumes analysts on the bullish side are expecting revenue growth of 10.5% a year, rising margins and a future P/E of 22.8x by 2029, with a fair value of US$650 based on those inputs and an 8.8% discount rate.
- Flags risks around Lennox International's reliance on North America, regulatory costs, labor constraints, and competition in high efficiency and smart HVAC solutions that could challenge those optimistic assumptions.
Fair Value: US$450.00
Gap to this Fair Value vs last close: about 15.1% above that fair value
Revenue growth assumption: 4.22% a year
- Highlights pressure from new HVAC technologies, tighter environmental rules, slower digital adoption, and North American concentration as reasons future revenue and earnings could be more limited.
- Works off analyst assumptions of 4.2% annual revenue growth, modest margin improvement and a lower future P/E of 19.6x by 2029, using a discount rate of 8.6% to reach a fair value of US$450.
- Points out that stronger product development, partnerships, and long running demand for energy efficiency could still support margins and cash flows, which would weaken the case for a lower valuation if they play out more positively than expected.
Once you have seen both sides like this, the key step is to decide which story feels closer to how you think Lennox International will actually perform. You can then sense check your own revenue, margin and P/E assumptions against these two reference points rather than treating either view as a final answer.
Do you think there's more to the story for Lennox International? Head over to our Community to see what others are saying!

This article by Simply Wall St is general in nature. We provide commentary based on historical data and analyst forecasts only using an unbiased methodology and our articles are not intended to be financial advice. It does not constitute a recommendation to buy or sell any stock, and does not take account of your objectives, or your financial situation. We aim to bring you long-term focused analysis driven by fundamental data. Note that our analysis may not factor in the latest price-sensitive company announcements or qualitative material. Simply Wall St has no position in any stocks mentioned.