

Is Marsh & McLennan (MRSH) Offering Value After Recent Share Price Weakness?
Marsh & McLennan Companies, Inc. MRSH | 0.00 |
- If you have been wondering whether Marsh & McLennan Companies at around US$173 a share is a fair deal or not, this article walks through what the current price might be implying about value.
- The stock has slipped around 0.8% over the last week, 0.5% over the last month and 5.1% year to date, with a 22.9% decline over the past year contrasted against 5.4% and 47.1% returns over the past 3 and 5 years.
- Recent news around Marsh & McLennan Companies has focused on the business as a major insurance broker and risk advisor, with attention on how its services fit into a sector that is closely watched by institutional investors. Commentary has also highlighted the stock's longer term record, which gives context to the more recent pullback.
- Right now the company holds a value score of 3 out of 6, and the rest of this article compares what different valuation methods say about the price today while keeping one more holistic way of thinking about valuation for the end.
Approach 1: Marsh & McLennan Companies Excess Returns Analysis
The Excess Returns model asks a simple question: does Marsh & McLennan Companies earn more on its equity than investors require, and if so, how much value does that create per share?
Here, the starting point is an estimated Book Value of $31.14 per share and a Stable EPS of $11.84 per share, based on weighted future Return on Equity estimates from 5 analysts. That implies an average Return on Equity of 30.37%, which is compared with a Cost of Equity of $2.72 per share. The gap between these, the Excess Return, is estimated at $9.12 per share.
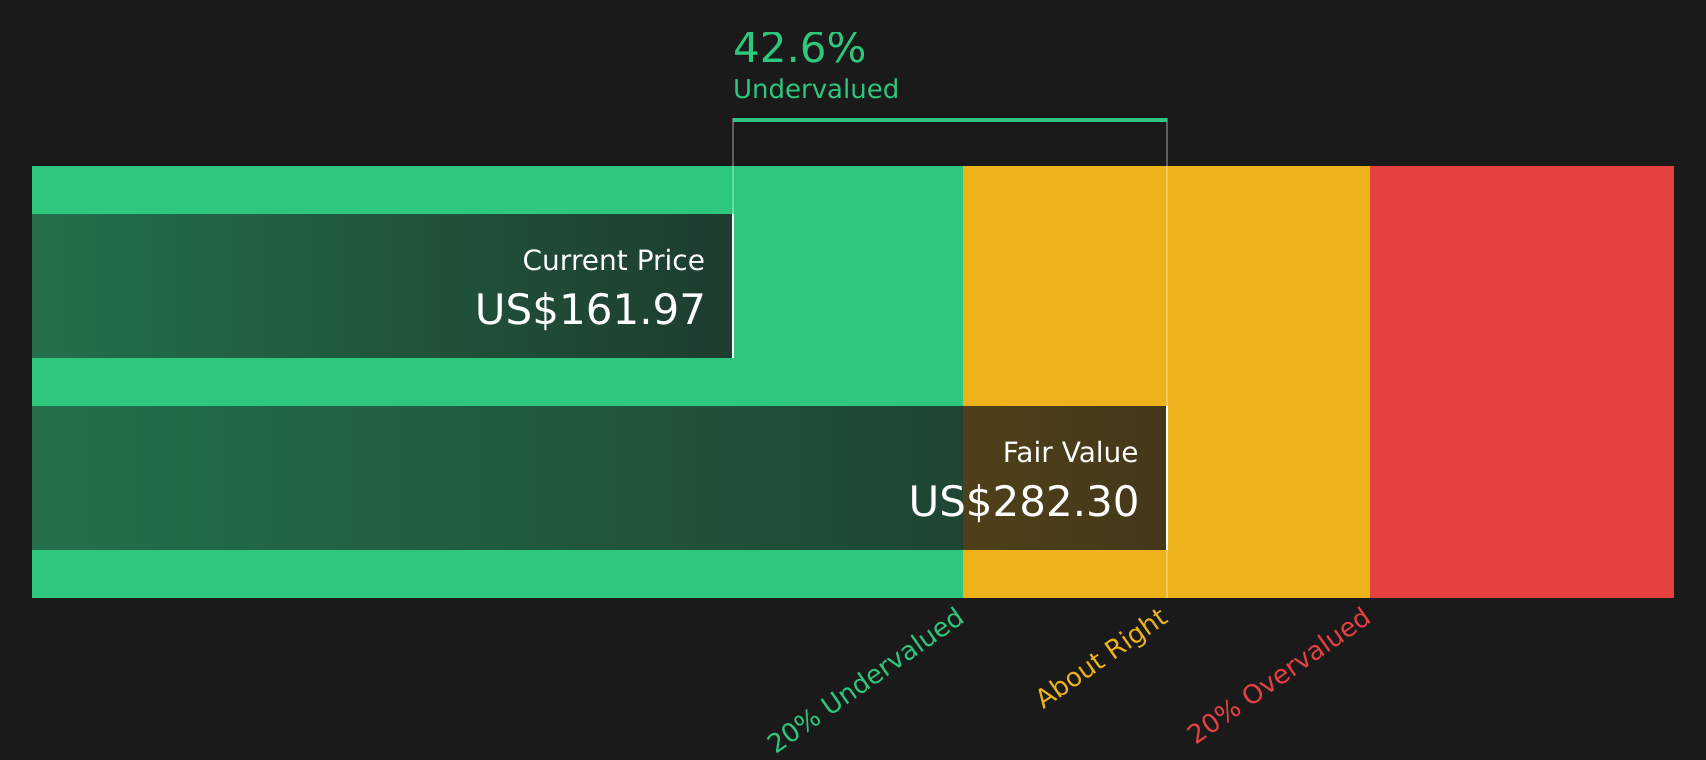
Using a Stable Book Value of $38.99 per share, sourced from weighted future Book Value estimates from 4 analysts, the model projects that Marsh & McLennan Companies continues to generate returns above its equity cost. Aggregating these excess returns gives an intrinsic value estimate of about $294.56 per share.
Against a share price of around $173, the Excess Returns valuation implies an intrinsic discount of 41.2%, which suggests that the stock may be significantly undervalued on this approach.
Result: UNDERVALUED
Our Excess Returns analysis suggests Marsh & McLennan Companies is undervalued by 41.2%. Track this in your watchlist or portfolio, or discover 62 more high quality undervalued stocks.
Approach 2: Marsh & McLennan Companies Price vs Earnings
P/E is a commonly used yardstick for profitable companies because it links what you pay directly to what the business earns per share. For investors, it is a quick way to see how much the market is currently willing to pay for each dollar of earnings.
What counts as a "normal" or "fair" P/E often reflects how fast earnings are expected to grow and how risky those earnings are perceived to be. Higher expected growth or lower perceived risk can justify a higher P/E, while lower growth or higher risk usually points to a lower multiple.
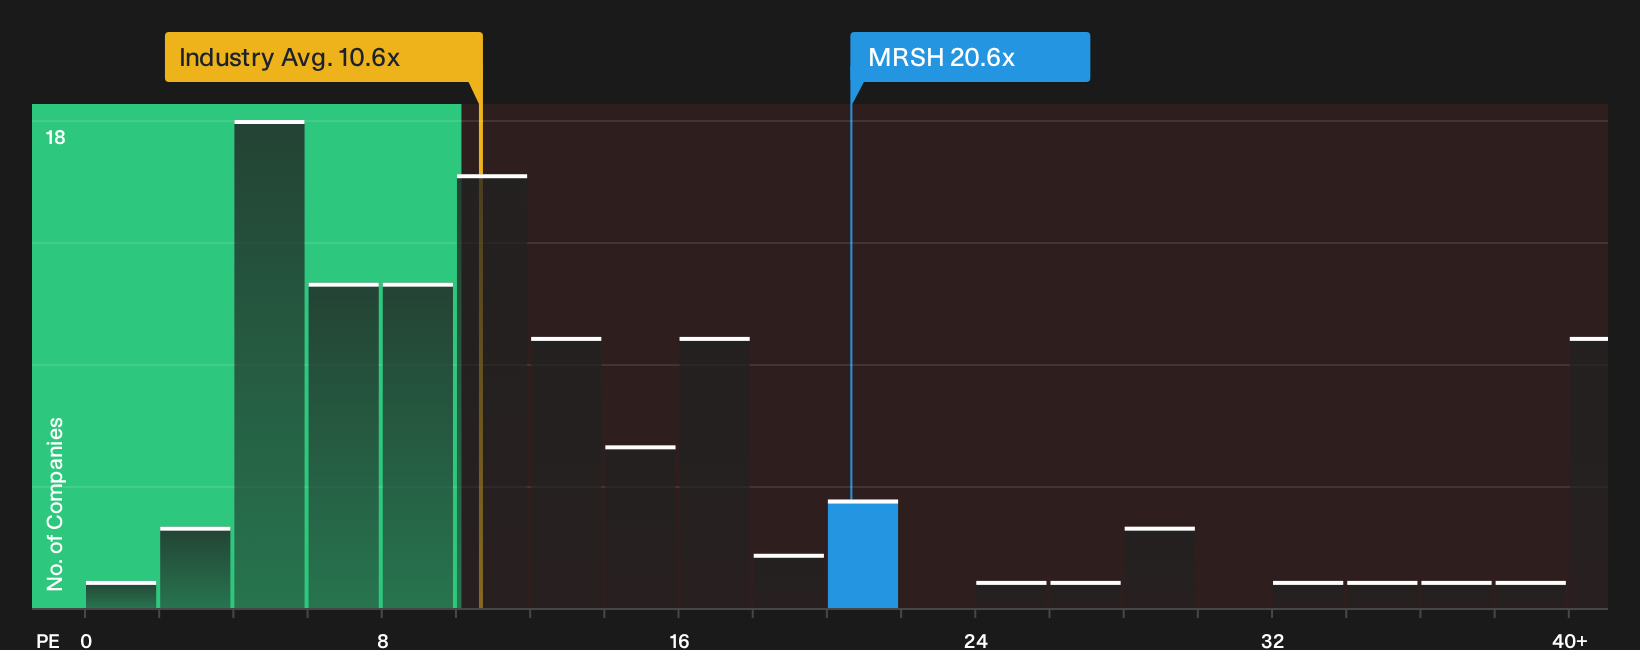
Marsh & McLennan Companies currently trades on a P/E of 20.15x. This sits above the Insurance industry average P/E of 11.54x, but below the peer group average of 23.79x. Simply Wall St also provides a proprietary “Fair Ratio” of 13.07x, which is an estimate of the P/E that might be appropriate given factors such as the company’s earnings profile, industry, profit margins, market value and key risks.
This Fair Ratio can be more informative than a simple comparison with peers or the broad industry because it attempts to adjust for differences in growth, risk, profitability, sector and size. Comparing the current P/E of 20.15x with the Fair Ratio of 13.07x suggests the shares trade above this modelled range.
Result: OVERVALUED
P/E ratios tell one story, but what if the real opportunity lies elsewhere? Start investing in legacies, not executives. Discover our 19 top founder-led companies.
Upgrade Your Decision Making: Choose your Marsh & McLennan Companies Narrative
Earlier it was mentioned that there is an even better way to understand valuation, so Narratives are introduced here as simple stories you create about Marsh & McLennan Companies that link your view on its future revenue, earnings and margins to a financial forecast, a fair value, and then a clear comparison with the current price. All of this is available within an easy tool on Simply Wall St's Community page that updates as news or earnings arrive. For example, one investor might build a Narrative around the higher analyst price target of US$236.0 with stronger long term assumptions, while another might lean toward the lower US$181.0 view with more cautious expectations. You can see both stories quantified side by side to help you decide whether the current price of around US$171.87 looks attractive or not based on your own assumptions.
Do you think there's more to the story for Marsh & McLennan Companies? Head over to our Community to see what others are saying!

This article by Simply Wall St is general in nature. We provide commentary based on historical data and analyst forecasts only using an unbiased methodology and our articles are not intended to be financial advice. It does not constitute a recommendation to buy or sell any stock, and does not take account of your objectives, or your financial situation. We aim to bring you long-term focused analysis driven by fundamental data. Note that our analysis may not factor in the latest price-sensitive company announcements or qualitative material. Simply Wall St has no position in any stocks mentioned.