Is MetLife (MET) Pricing Look Attractive After Recent Share Price Pullback
MetLife, Inc. MET | 76.72 | +0.89% |
- If you are wondering whether MetLife's current share price reflects its true worth, you are not alone. That is exactly what this valuation focused review aims to unpack.
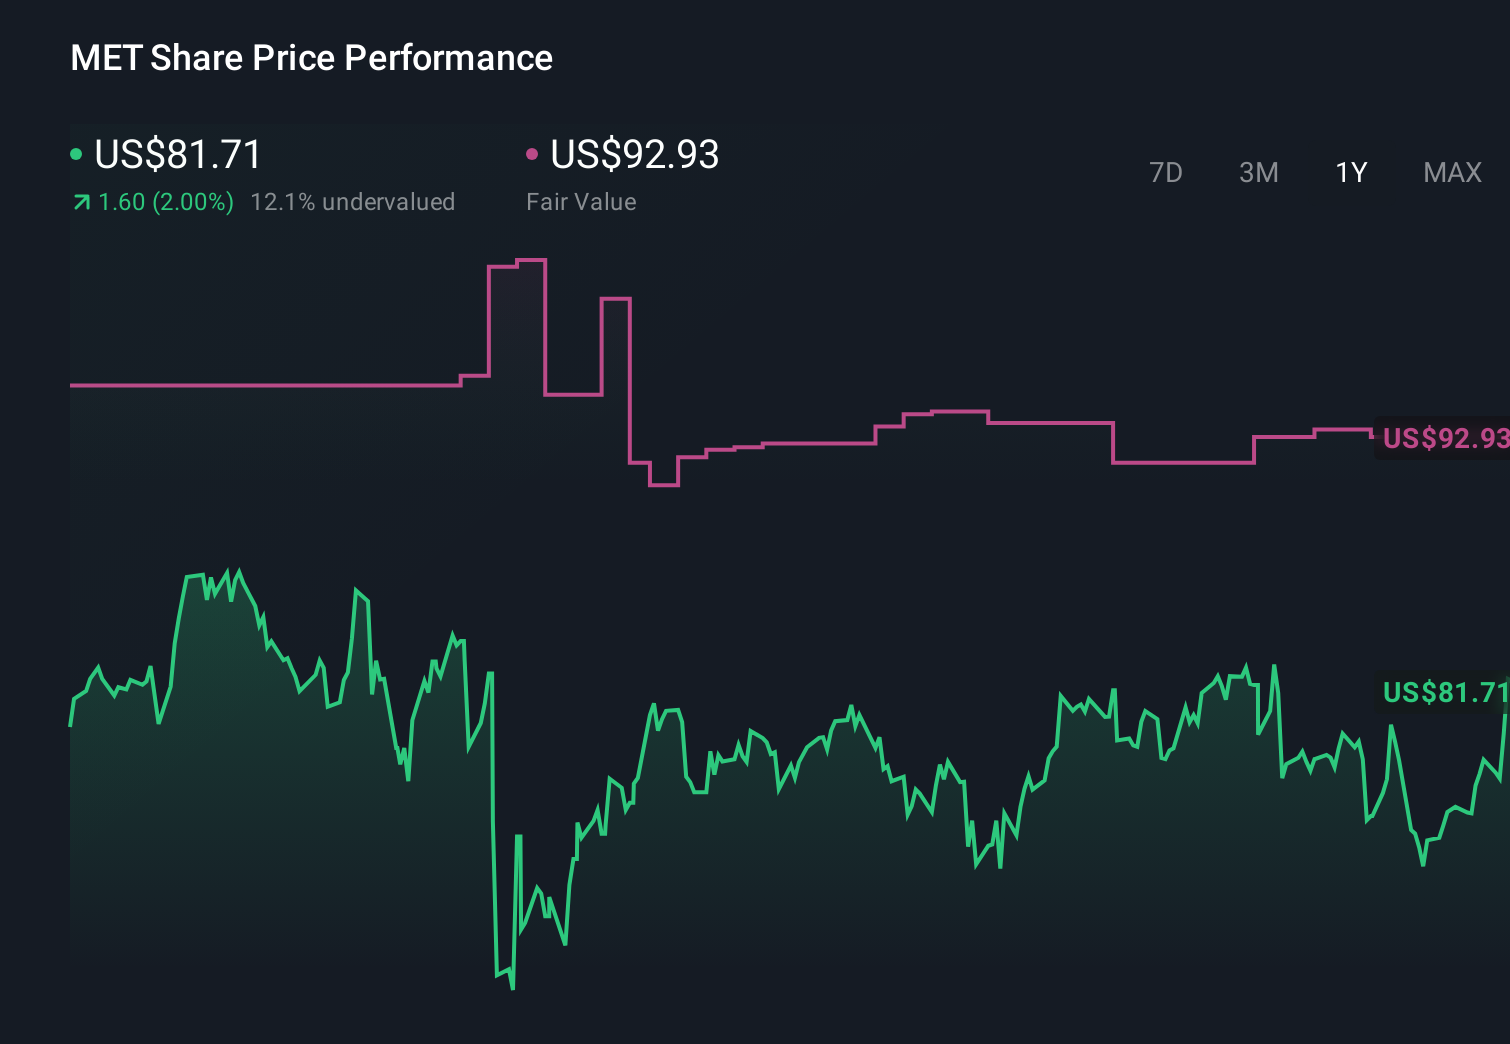
- MetLife recently closed at US$75.32, with returns of 3.7% decline over 7 days, 7.2% decline over 30 days, 6.2% decline year to date and 7.3% decline over 1 year, compared with longer term returns of 16.8% over 3 years and 58.5% over 5 years.
- Recent attention around MetLife has centered on its position as a large, established US insurance group and how investors weigh that scale against sector wide concerns such as interest rate trends and capital requirements. For many readers, this context helps frame whether the recent pullback reflects shifting risk perceptions around insurers in general or something more company specific.
- Our Simply Wall St valuation checks suggest MetLife scores 4 out of 6 for potential undervaluation. Next we will walk through the different valuation approaches that feed into that score and then finish with a way to look at value that goes beyond any single model.
Approach 1: MetLife Excess Returns Analysis
The Excess Returns model looks at how effectively MetLife turns its equity base into profits after covering the cost of that equity. In simple terms, it compares what shareholders are putting into the business with what they are getting back, above a required return.
For MetLife, the starting point is a Book Value of US$43.81 per share and a Stable EPS of US$8.15 per share, based on weighted future Return on Equity estimates from 6 analysts. The Average Return on Equity is 16.08%, while the Cost of Equity is estimated at US$3.54 per share. That leaves an Excess Return of US$4.62 per share, which is what this model treats as value created over and above the required return.
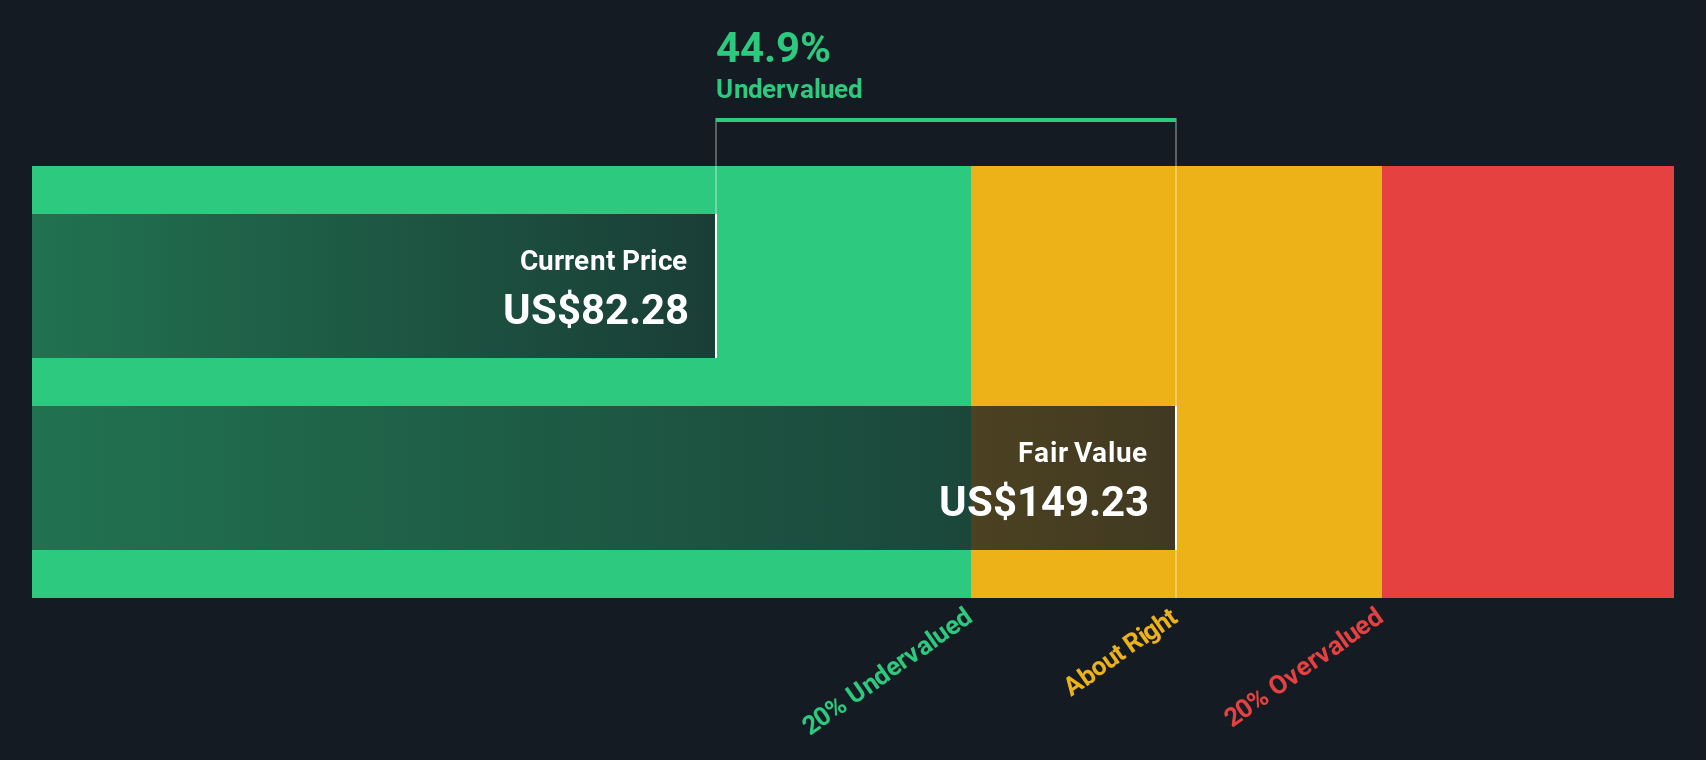
The Stable Book Value is US$50.69 per share, sourced from weighted future Book Value estimates from 5 analysts. Feeding these inputs into the Excess Returns framework produces an estimated intrinsic value of about US$180.06 per share, which implies the stock is 58.2% undervalued compared with the recent share price of US$75.32.
Result: UNDERVALUED
Our Excess Returns analysis suggests MetLife is undervalued by 58.2%. Track this in your watchlist or portfolio, or discover 55 more high quality undervalued stocks.
Approach 2: MetLife Price vs Earnings
For a profitable company like MetLife, the P/E ratio is a useful shorthand for what the market is currently paying for each dollar of earnings. It lets you line up price directly against the business’s ability to generate profits.
What counts as a normal or fair P/E will usually reflect investor expectations for future earnings and the level of risk they see in those earnings. Higher growth or lower perceived risk often supports a higher P/E, while lower growth or higher risk tends to point to a lower P/E.
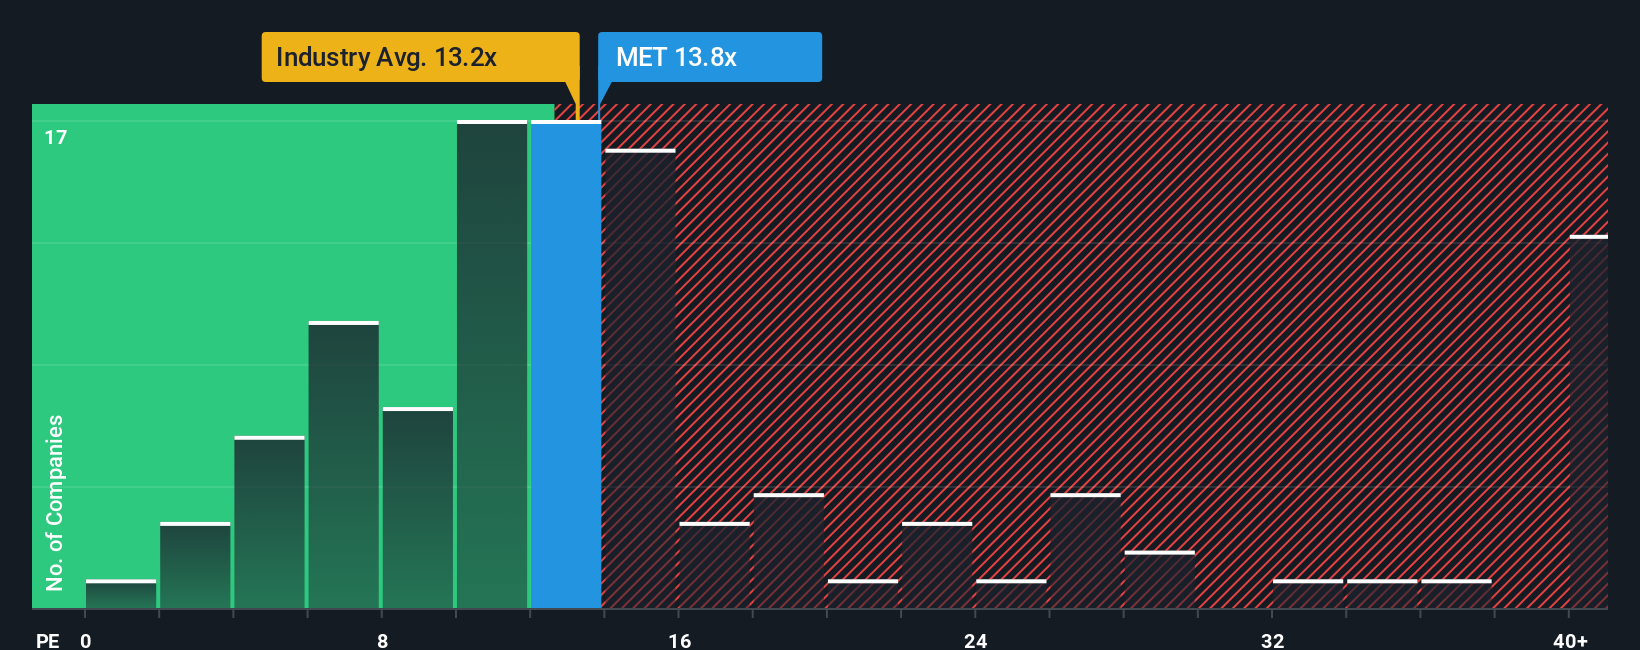
MetLife currently trades on a P/E of 15.56x. That is above the Insurance industry average of 12.87x and also above the peer group average of 12.95x. Simply Wall St’s Fair Ratio for MetLife is 17.65x, which is its view of what a suitable P/E could be given factors like earnings growth, profit margins, industry, market cap and company specific risks.
The Fair Ratio can be more informative than a simple comparison with peers or the sector because it adjusts for those company specific drivers rather than assuming one size fits all. On this basis, MetLife’s actual P/E of 15.56x is below the Fair Ratio of 17.65x, which indicates that the shares may be undervalued on this metric.
Result: UNDERVALUED
P/E ratios tell one story, but what if the real opportunity lies elsewhere? Start investing in legacies, not executives. Discover our 22 top founder-led companies.
Upgrade Your Decision Making: Choose your MetLife Narrative
Earlier we mentioned that there is an even better way to understand valuation, so let us introduce you to Narratives, where you connect your view of MetLife’s future with the numbers behind it. A Narrative is simply your story for the company, linked to your own assumptions for fair value, future revenue, earnings and margins. On Simply Wall St’s Community page, millions of investors use Narratives to tie that story to a financial forecast, then to a fair value that can be compared directly with the current share price to help decide whether it is the right time to buy or sell. Because Narratives update when new information like news or earnings arrives, your view of MetLife can stay current without you rebuilding the whole analysis each time. For example, one MetLife Narrative might assume a relatively low fair value and modest profit margins while another assumes a higher fair value with stronger margins, which clearly shows how different perspectives can still be grounded in transparent numbers.
Do you think there's more to the story for MetLife? Head over to our Community to see what others are saying!
This article by Simply Wall St is general in nature. We provide commentary based on historical data and analyst forecasts only using an unbiased methodology and our articles are not intended to be financial advice. It does not constitute a recommendation to buy or sell any stock, and does not take account of your objectives, or your financial situation. We aim to bring you long-term focused analysis driven by fundamental data. Note that our analysis may not factor in the latest price-sensitive company announcements or qualitative material. Simply Wall St has no position in any stocks mentioned.