Is Moelis (MC) Pricing Fully Reflect Recent Share Gains And Mixed Valuation Signals
Moelis & Co. Class A MC | 0.00 |
- Wondering if Moelis at around US$67.86 is offering good value or just pricing in a strong story already? This article breaks down what the current share price really reflects.
- The stock has returned 0.8% over the last 7 days and 6.4% over the last 30 days, while year to date it is down 4.7%. It sits on a 19.6% return over the past year, 78.9% over 3 years and 61.8% over 5 years.
- Recent coverage has focused on Moelis within the broader capital markets sector and investor interest around advisory activity, giving context to how the stock has behaved across different time frames. Those stories have kept attention on the business model and dealmaking backdrop, which can influence how investors think about what they are willing to pay for the stock.
- On Simply Wall St's valuation framework, Moelis scores 3 out of 6. The rest of this article will compare different valuation methods to that score, before finishing with a broader way to think about what the stock might be worth to you.
Approach 1: Moelis Excess Returns Analysis
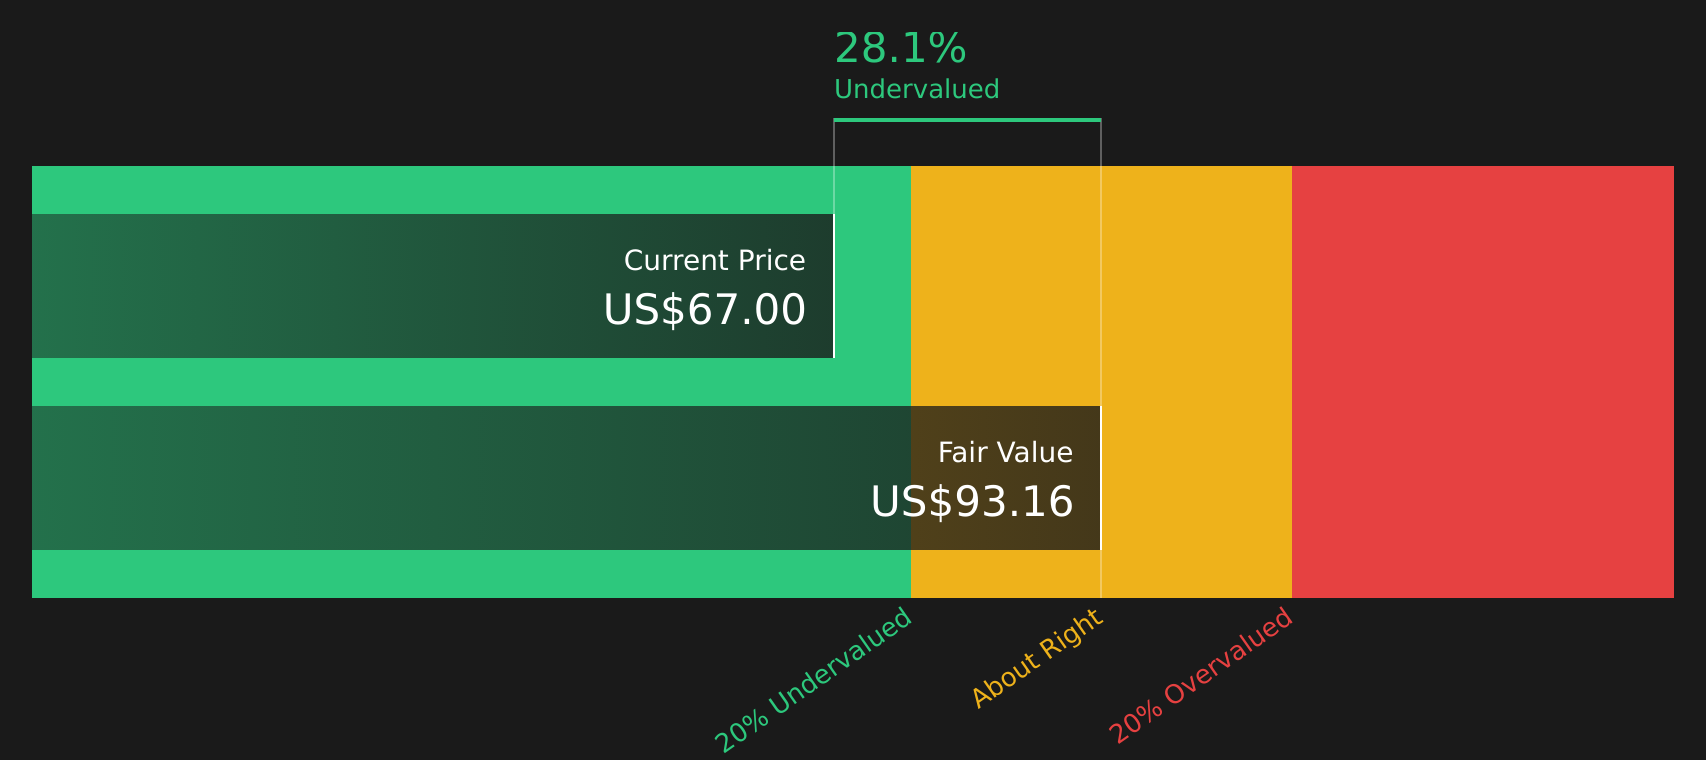
The Excess Returns model examines how much profit a company can generate over and above the return that shareholders require, based on the equity invested in the business. Instead of focusing on cash flows, it uses book value and earnings power to estimate what the stock could be worth today.
For Moelis, the model uses a Book Value of $6.55 per share and a Stable EPS of $4.21 per share, based on weighted future Return on Equity estimates from 4 analysts. The Average Return on Equity is 53.22%, compared with a Cost of Equity of $0.62 per share. That gap feeds into an Excess Return of $3.60 per share. Stable Book Value is set at $7.92 per share, using weighted future Book Value estimates from the same analysts.
Under Simply Wall St's Excess Returns framework, this points to an intrinsic value of about $92.23 per share. Compared with the recent share price of around $67.86, the model implies the stock is roughly 26.4% undervalued on these assumptions.
Result: UNDERVALUED
Our Excess Returns analysis suggests Moelis is undervalued by 26.4%. Track this in your watchlist or portfolio, or discover 49 more high quality undervalued stocks.
Approach 2: Moelis Price vs Earnings
For a profitable company like Moelis, the P/E ratio is a useful shorthand for what investors are currently willing to pay for each dollar of earnings. It links directly to earnings power, which is often the starting point for judging how a business is being priced.
In general, higher growth expectations and lower perceived risk can support a higher P/E, while slower expected growth or higher risk usually point to a lower, more conservative multiple. Moelis trades on a P/E of 22.82x, compared with a Capital Markets industry average of about 39.15x and a peer group average of 20.61x.
Simply Wall St's Fair Ratio for Moelis is 15.15x. This is a proprietary estimate of what the P/E might reasonably be, given factors such as earnings growth, profit margins, industry, market cap and company specific risks. Because it blends these fundamentals rather than relying only on broad industry or peer comparisons, it can give a more tailored view of what investors might consider a balanced multiple. Set against the current P/E of 22.82x, the Fair Ratio suggests the stock is trading above that fundamental anchor.
Result: OVERVALUED

P/E ratios tell one story, but what if the real opportunity lies elsewhere? Start investing in legacies, not executives. Discover our 21 top founder-led companies.
Upgrade Your Decision Making: Choose your Moelis Narrative
Earlier it was mentioned that there is an even better way to understand valuation. Narratives are Simply Wall St's way for you to attach a clear story to the numbers by linking your view on Moelis's future revenue, earnings and margins to a forecast and a Fair Value that can be compared directly with the current share price on the Community page. Because these Narratives refresh when new information such as news or earnings is added, you can easily see how different perspectives line up. For example, one investor might align with a higher Fair Value around US$86.00, while another might only be comfortable closer to US$58.00. Both views are captured in a simple, accessible format that helps you decide whether the gap between price and Fair Value looks attractive to you or not.
For Moelis however we will make it really easy for you with previews of two leading Moelis Narratives:
Start with a bullish scenario that lines up with the higher analyst targets. Then contrast it against a more cautious take that leans on a lower Fair Value. Seeing both side by side gives you a clear range for what the stock could be worth to different types of investors and highlights which assumptions you agree with most.
Fair Value: US$86.00
Implied discount to Fair Value vs the recent price of US$67.86: about 21.1% undervalued
Revenue growth used in this narrative: 18.62% a year
- Assumes Moelis converts a strong advisory pipeline, sector demand and global deal flow into higher M&A and capital markets revenue than current forecasts.
- Leans on hiring momentum, a capital light model and buybacks to support earnings growth, returns on equity and shareholder returns.
- Flags key watchpoints around competition, deal cyclicality, compensation costs and geographic and digital diversification that could limit how much of the upside is realized.
Fair Value: US$58.00
Implied premium to Fair Value vs the recent price of US$67.86: about 17.0% overvalued
Revenue growth used in this narrative: 15.03% a year
- Builds in pressure on the traditional advisory model from AI, automation and direct capital access, which could weigh on fees and add revenue volatility over time.
- Highlights the reliance on transaction based revenues, rising competition and higher compliance demands as ongoing headwinds for earnings stability and margins.
- Still acknowledges the role of expansion efforts, market momentum and a cash rich balance sheet, but treats the current share price as too full for the risks outlined.
If you are weighing up Moelis at around US$67.86, these two Narratives effectively frame the current valuation debate in numbers you can stress test against your own expectations for deal activity, fee pressure and capital returns.
To see how these results tie into long-term growth, risks, and valuation, check out the full range of community narratives for Moelis on Simply Wall St. Add the company to your watchlist or portfolio so you'll be alerted when the story evolves.
Do you think there's more to the story for Moelis? Head over to our Community to see what others are saying!

This article by Simply Wall St is general in nature. We provide commentary based on historical data and analyst forecasts only using an unbiased methodology and our articles are not intended to be financial advice. It does not constitute a recommendation to buy or sell any stock, and does not take account of your objectives, or your financial situation. We aim to bring you long-term focused analysis driven by fundamental data. Note that our analysis may not factor in the latest price-sensitive company announcements or qualitative material. Simply Wall St has no position in any stocks mentioned.