Is Mohawk Industries (MHK) Offering Opportunity After Recent Share Price Weakness?
Mohawk Industries, Inc. MHK | 96.80 | -2.66% |
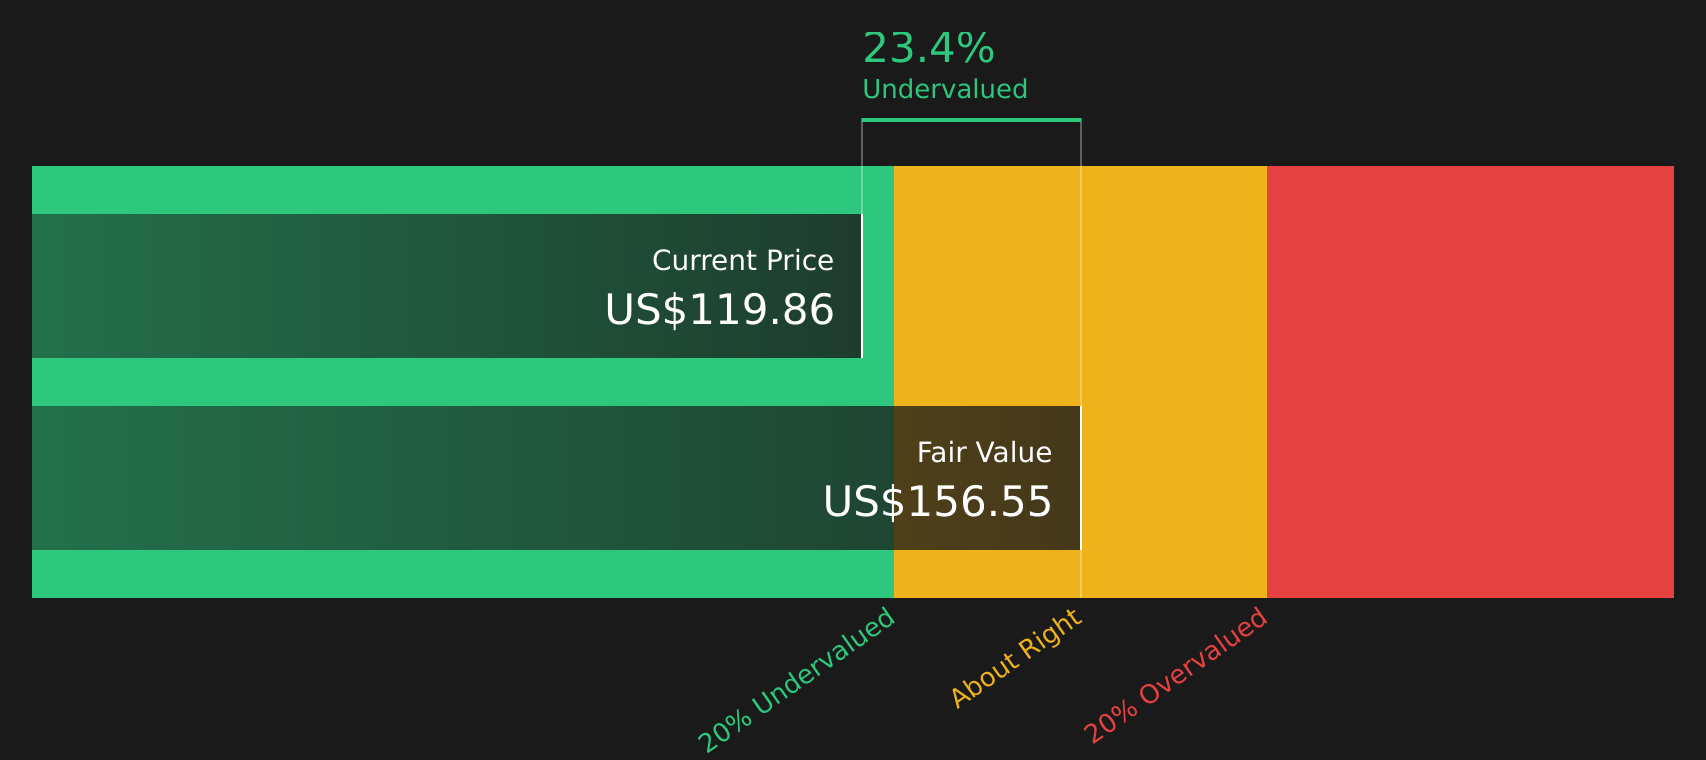
- If you are wondering whether Mohawk Industries at around US$123.48 is offering fair value or a potential discount, you are not alone. The answer depends on which valuation lens you use.
- The share price has moved around recently, with a 5.7% decline over the last 7 days, a 2.5% gain over 30 days, a 12.8% return year to date, and 4.1%, 22.0% and 32.4% decline over the last 1, 3 and 5 years respectively. These movements can change how investors think about both opportunity and risk.
- Recent headlines around Mohawk Industries have focused on ongoing demand trends in flooring and building products, as well as management actions to adjust capacity and costs as conditions change. These stories help frame why the share price has been moving and set useful context for judging whether the current price makes sense.
- On our checks, Mohawk Industries earns a valuation score of 3 out of 6. This means some methods flag the stock as potentially undervalued while others are more cautious. Next, we will walk through those approaches and then finish with a broader way to think about what valuation really tells you as an investor.
Approach 1: Mohawk Industries Discounted Cash Flow (DCF) Analysis
A Discounted Cash Flow model estimates what a company could be worth by projecting its future cash flows and discounting them back to today to reflect time and risk. For Mohawk Industries, the model used here is a 2 Stage Free Cash Flow to Equity approach built on cash flow projections.
The latest twelve month free cash flow is about $559.9 million. Analysts provide explicit forecasts for the next few years, and Simply Wall St then extends those out further using its own assumptions, giving projected free cash flow of $601.5 million in 2026, $682.5 million in 2027 and $655.0 million in 2028. Beyond that, the model extrapolates to around $712.1 million in 2035, with each of these future figures discounted back to a present value in dollars.
Adding all those discounted cash flows together gives an estimated intrinsic value of about $150.94 per share. Compared with the recent share price of roughly $123.48, the DCF output suggests Mohawk Industries trades at about an 18.2% discount to this estimate.
Result: UNDERVALUED
Our Discounted Cash Flow (DCF) analysis suggests Mohawk Industries is undervalued by 18.2%. Track this in your watchlist or portfolio, or discover 53 more high quality undervalued stocks.
Approach 2: Mohawk Industries Price vs Earnings
For a profitable business like Mohawk Industries, the P/E ratio is a useful way to think about what you are paying for each dollar of earnings. It ties the share price directly to the company’s current earnings, which is often how the market quickly compares similar companies.
What counts as a “normal” P/E depends on how investors view growth potential and risk. Higher expected growth or lower perceived risk can justify a higher P/E, while slower growth or higher risk usually lines up with a lower one.
Mohawk Industries currently trades on a P/E of about 20.52x. That sits above the Consumer Durables industry average of 13.10x and slightly below the peer average of 21.21x. Simply Wall St also calculates a “Fair Ratio” of 23.03x, which is the P/E it estimates could be appropriate after considering factors like earnings growth, profit margins, industry, market cap and company specific risks.
This Fair Ratio can give a more tailored view than a simple industry or peer comparison because it adjusts for those company level characteristics rather than assuming all firms deserve the same multiple. With Mohawk Industries trading on 20.52x versus a Fair Ratio of 23.03x, this approach indicates the shares are undervalued on a P/E basis.
Result: UNDERVALUED

P/E ratios tell one story, but what if the real opportunity lies elsewhere? Start investing in legacies, not executives. Discover our 21 top founder-led companies.
Upgrade Your Decision Making: Choose your Mohawk Industries Narrative
Earlier we mentioned that there is an even better way to understand valuation. Let us introduce you to Narratives, which are your own story about Mohawk Industries that connects what you think will happen to its revenue, earnings and margins with a financial forecast, a fair value and a simple comparison between that fair value and the current share price. All of this is packaged into an easy tool on Simply Wall St's Community page that millions of investors use. Narratives update automatically when fresh news or earnings arrive. For example, one investor might build a more optimistic Mohawk Industries view closer to the higher US$150 price target while another might lean toward the more cautious US$120 target, each using the same company but different assumptions to decide whether the price they see today lines up with the story they believe.
Do you think there's more to the story for Mohawk Industries? Head over to our Community to see what others are saying!

This article by Simply Wall St is general in nature. We provide commentary based on historical data and analyst forecasts only using an unbiased methodology and our articles are not intended to be financial advice. It does not constitute a recommendation to buy or sell any stock, and does not take account of your objectives, or your financial situation. We aim to bring you long-term focused analysis driven by fundamental data. Note that our analysis may not factor in the latest price-sensitive company announcements or qualitative material. Simply Wall St has no position in any stocks mentioned.