Is Nucor (NUE) Still Attractive After Strong 1-Year Share Price Performance?
Nucor Corporation NUE | 172.46 | -0.73% |
- If you are wondering whether Nucor’s current share price fairly reflects its underlying worth, you are not alone. This article is designed to help you assess that.
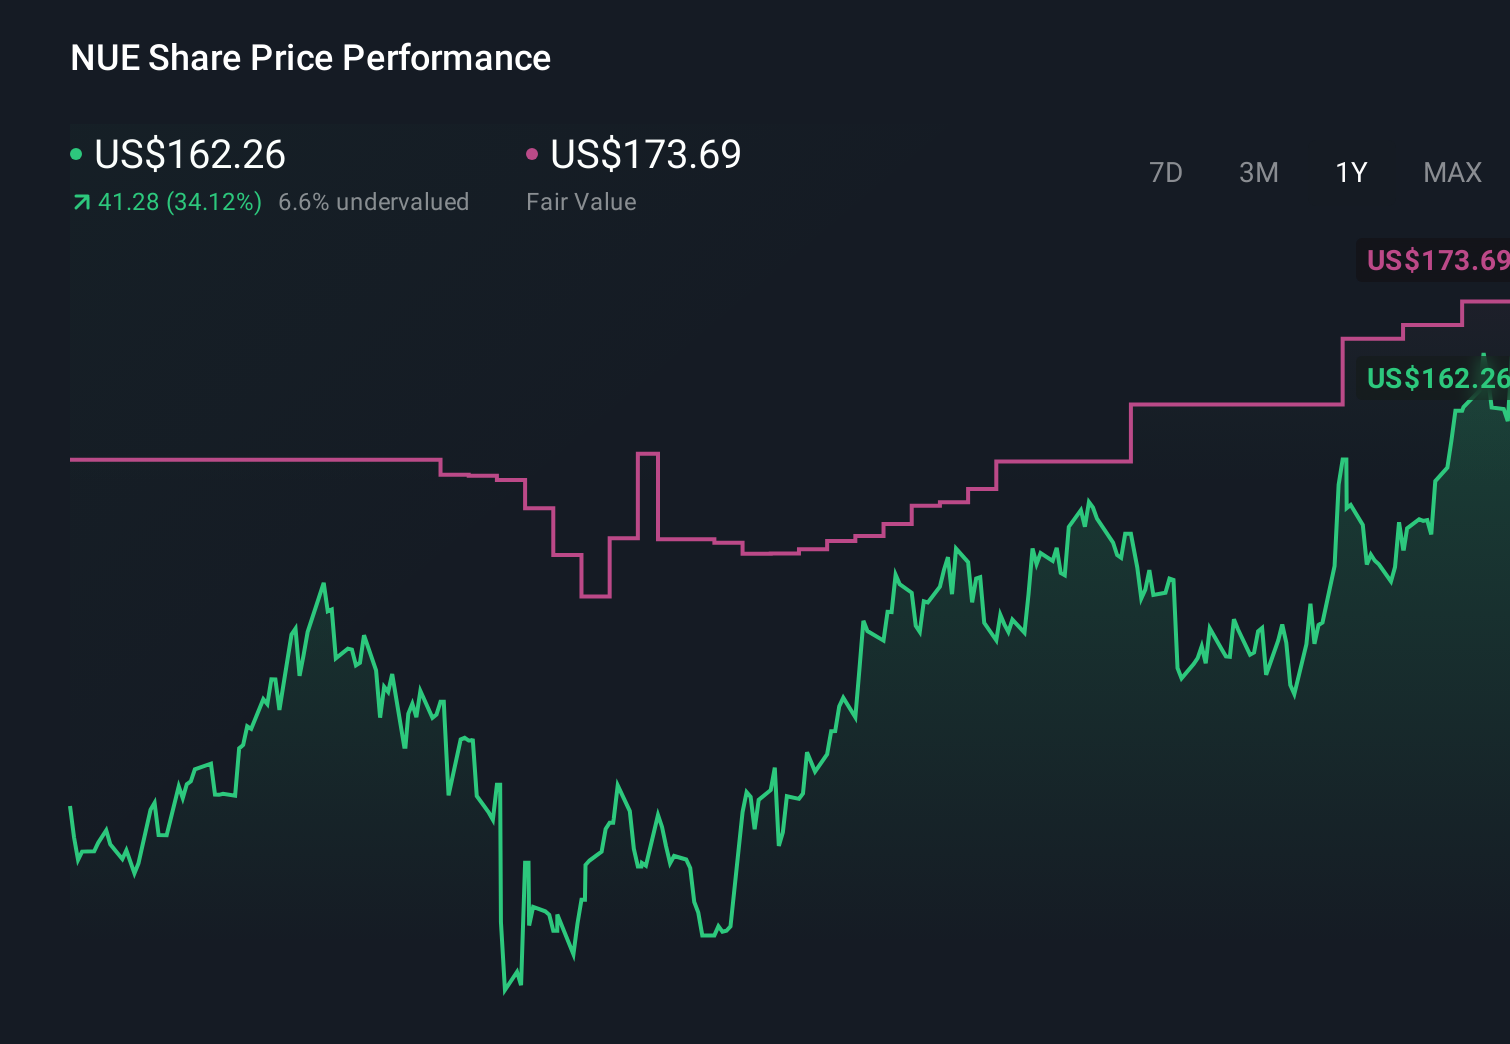
- Nucor’s stock closed at US$194.42, with returns of 2.4% over 7 days, 17.1% over 30 days, 14.8% year to date, 48.0% over 1 year and 19.4% over 3 years. These moves naturally raise questions about how the valuation stacks up.
- Recent attention on Nucor has focused on its role in the US materials sector and how investors are thinking about steel demand and capital spending. This ties directly into how the market is pricing the shares today. News coverage has also highlighted ongoing interest in companies connected to infrastructure and construction activity, providing context for why sentiment around Nucor has been in focus.
- On our framework of 6 valuation checks, Nucor records a value score of 4. Next, we will walk through the key valuation approaches behind that figure and then finish with a different way of thinking about valuation that many investors overlook.
Approach 1: Nucor Discounted Cash Flow (DCF) Analysis
A Discounted Cash Flow, or DCF, model estimates what a company could be worth by projecting its future cash flows and then discounting those back to today’s value using a required return.
For Nucor, the model used is a 2 Stage Free Cash Flow to Equity approach. The latest twelve month free cash flow is about $311.46 million. Analysts provide explicit forecasts for several years, and beyond that, Simply Wall St extrapolates those estimates to build a ten year path of free cash flows. On this basis, Nucor’s projected free cash flow in 2035 is $9.23b, with intermediate years such as 2026 at $1.93b and 2027 at $3.16b, all expressed in dollars.
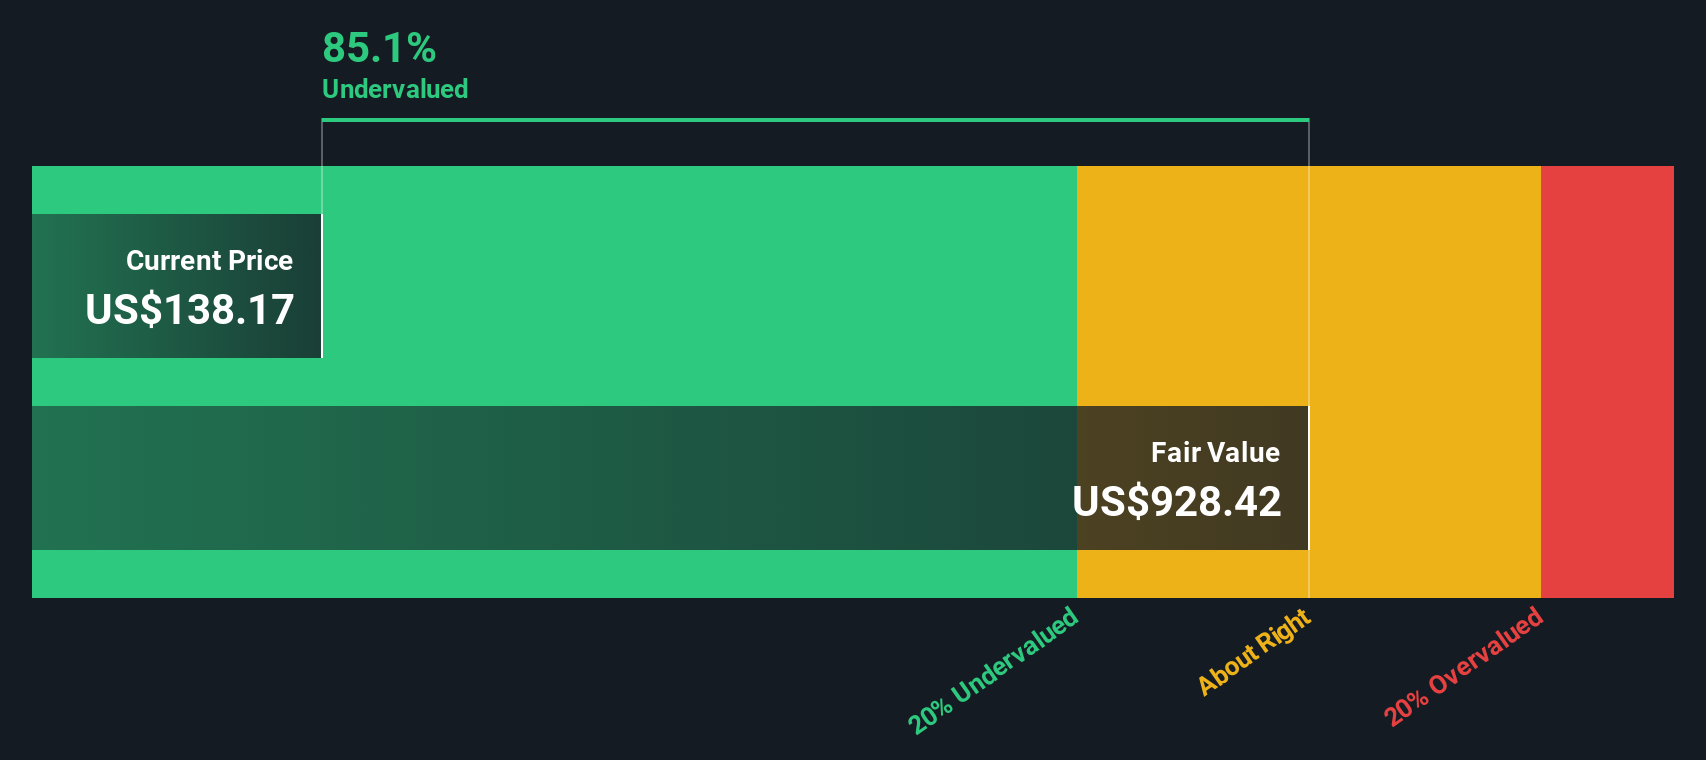
After discounting this stream of projected cash flows back to today, the DCF model arrives at an estimated intrinsic value of $519.23 per share. Compared with the recent share price of $194.42, this implies the stock is 62.6% undervalued according to this method.
Result: UNDERVALUED
Our Discounted Cash Flow (DCF) analysis suggests Nucor is undervalued by 62.6%. Track this in your watchlist or portfolio, or discover 51 more high quality undervalued stocks.
Approach 2: Nucor Price vs Earnings
For a profitable company, the P/E ratio is a useful way to see what investors are currently paying for each dollar of earnings. It links price directly to profitability, which is often a primary driver of long term returns.
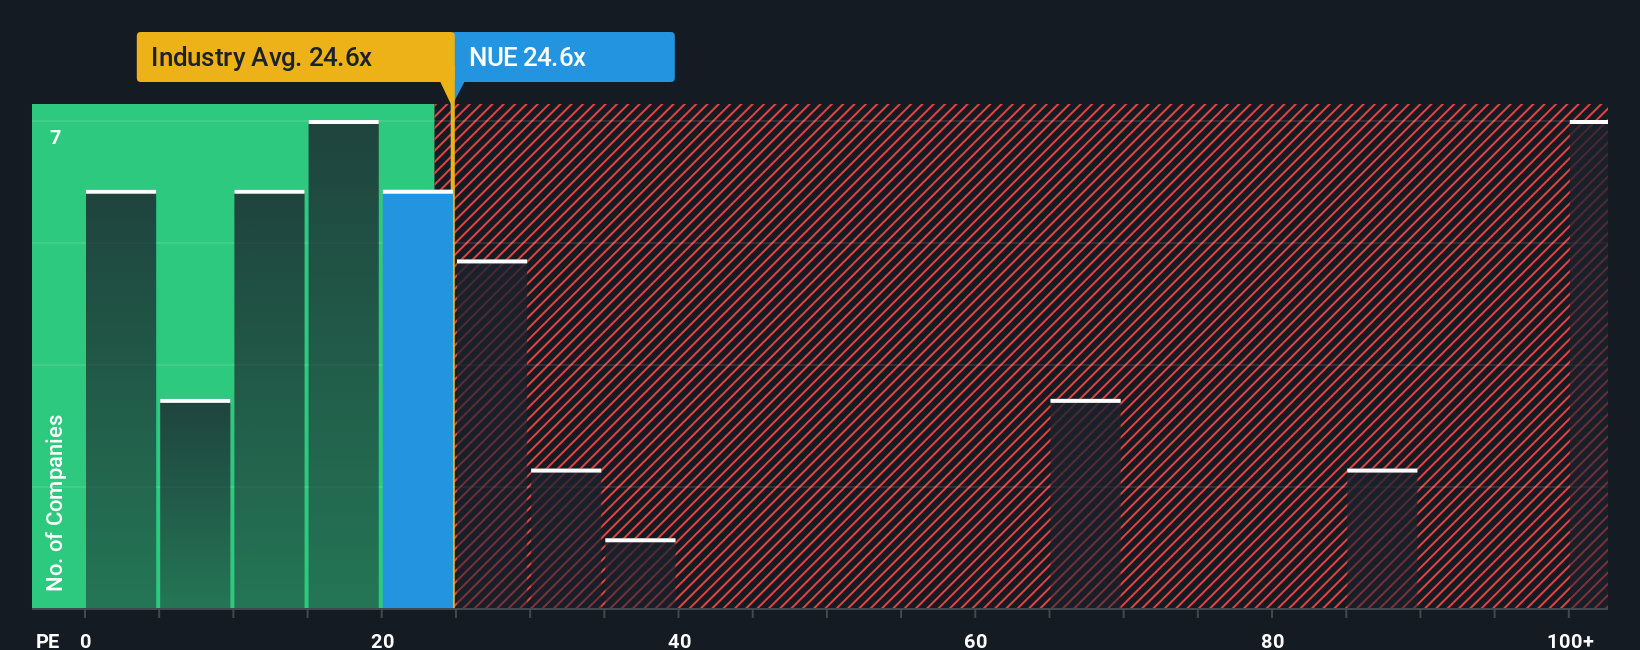
In general, higher growth expectations or lower perceived risk can support a higher "normal" P/E ratio, while lower growth or higher risk often line up with a lower multiple. Nucor currently trades on a P/E of 25.5x. That sits below the Metals and Mining industry average of 27.3x and above the peer group average of 21.9x, so on simple comparisons the stock looks somewhere in the middle of those reference points.
Simply Wall St’s Fair Ratio for Nucor is 29.3x. This is a proprietary estimate of what the P/E could be given factors such as the company’s earnings profile, its industry, profit margins, market cap and risk characteristics. Because it blends these elements, the Fair Ratio can be more tailored than a straight comparison with peers or a broad industry average. With the current P/E of 25.5x sitting below the Fair Ratio of 29.3x, this approach suggests the shares may be trading at a discount to that tailored benchmark.
Result: UNDERVALUED
P/E ratios tell one story, but what if the real opportunity lies elsewhere? Start investing in legacies, not executives. Discover our 22 top founder-led companies.
Upgrade Your Decision Making: Choose your Nucor Narrative
Earlier we mentioned that there is an even better way to understand valuation, so let us introduce you to Narratives, a simple way for you to write the story you believe about Nucor, link that story to your own forecasts for revenue, earnings and margins, and arrive at a fair value you can compare with the current share price.
A Narrative on Simply Wall St’s Community page connects three things in one place: your view of the business, the financial model that flows from that view, and the fair value that drops out of those assumptions, so you can quickly see if the price looks high, low or in line with what you think the company is worth.
Because Narratives live on the platform used by millions of investors and are updated when new information such as news, earnings guidance or changes in analyst targets comes through, they can give you a living view of how your thesis on Nucor holds up as the facts change.
For example, one investor might build a Nucor Narrative around the higher fair value work near US$186 and a price target of US$182, while another may anchor on the more cautious US$145 target. By comparing each Narrative’s fair value to today’s market price, they can decide for themselves whether Nucor currently looks closer to an opportunity or a hold.
Do you think there's more to the story for Nucor? Head over to our Community to see what others are saying!
This article by Simply Wall St is general in nature. We provide commentary based on historical data and analyst forecasts only using an unbiased methodology and our articles are not intended to be financial advice. It does not constitute a recommendation to buy or sell any stock, and does not take account of your objectives, or your financial situation. We aim to bring you long-term focused analysis driven by fundamental data. Note that our analysis may not factor in the latest price-sensitive company announcements or qualitative material. Simply Wall St has no position in any stocks mentioned.