Is PG&E (PCG) Still Attractive After Recent Share Price Gains And Ongoing Risk Debates
PG&E Corporation PCG | 17.39 | -0.97% |
- If you are wondering whether PG&E at around US$16.75 is still a smart place for your money, the key question is what you are really paying for today.
- The stock has moved recently, with returns of 9.2% over the last 7 days, 5.7% over the last month, 3.0% year to date, 7.0% over 1 year, 8.8% over 3 years and 43.6% over 5 years, which may have changed how the market views its risk and reward trade off.
- Recent headlines around PG&E have continued to focus on the company’s regulated utility role in California and the ongoing market debate about how investors should price that position. This backdrop helps explain why the share price has been active, as investors reassess what level of risk is acceptable for the potential return.
- Our valuation checklist gives PG&E a 4 out of 6 score. This means it screens as undervalued on most of the metrics assessed. Next we will walk through the main valuation methods behind that, before finishing with a framework that can help you think about value in an even more complete way.
Approach 1: PG&E Dividend Discount Model (DDM) Analysis
The Dividend Discount Model looks at a stock as the present value of all future dividends, adjusted for how fast those dividends are expected to grow and the risk investors take on to receive them.
For PG&E, the model uses a recent annual dividend per share of about $0.33, a return on equity of 8.45% and a payout ratio of 3.47. Because that payout is high, the implied long term dividend growth rate is capped at 3.41%, even though the broader expected growth input is 8.15%. This cap is intended to keep the dividend path more sustainable in the model rather than assuming aggressive growth.
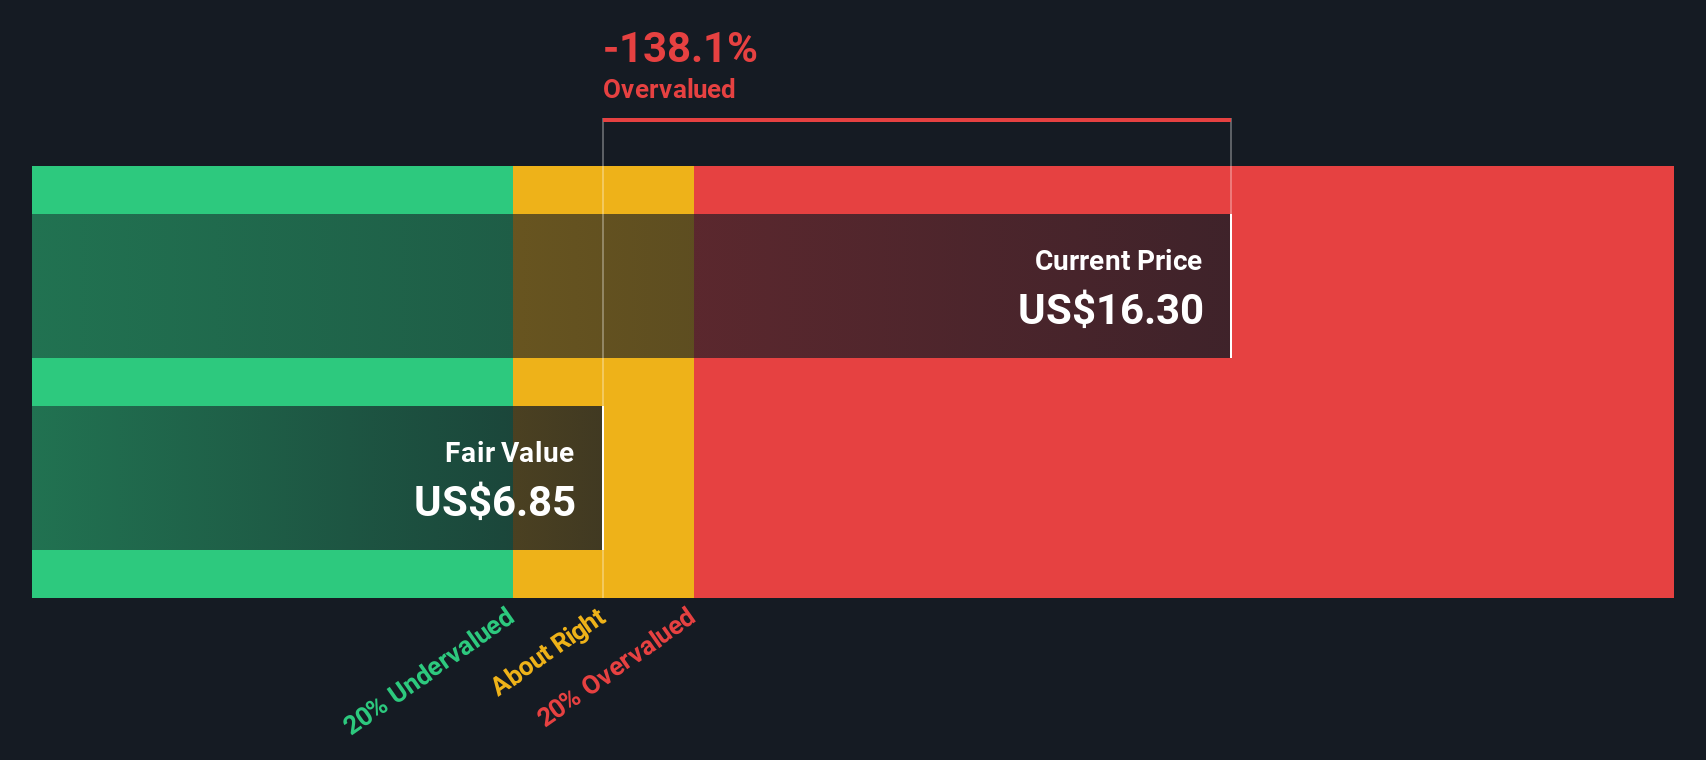
Putting these inputs together, the DDM arrives at an estimated intrinsic value of about US$9.21 per share. Compared with the recent share price around US$16.75, the model implies the stock is about 81.8% overvalued based purely on its dividend stream.
Result: OVERVALUED
Our Dividend Discount Model (DDM) analysis suggests PG&E may be overvalued by 81.8%. Discover 51 high quality undervalued stocks or create your own screener to find better value opportunities.
Approach 2: PG&E Price vs Earnings
For profitable companies, the P/E ratio is a useful way to think about what you are paying for each dollar of earnings. This makes it a practical yardstick for a regulated utility like PG&E.
What counts as a “normal” or “fair” P/E depends on two big levers: how quickly earnings are expected to grow, and how much risk investors see in those earnings. Higher expected growth or lower perceived risk usually supports a higher P/E. Slower growth or higher risk tends to justify a lower one.
PG&E currently trades on a P/E of 14.17x. That sits below the Electric Utilities industry average of 21.36x and also below the peer group average of 21.40x. Simply Wall St’s Fair Ratio for PG&E is 25.71x, which is its view of what a suitable P/E could be after accounting for the company’s earnings profile, industry, profit margins, market value and risk factors.
This Fair Ratio is more tailored than a simple comparison to industry or peers, because it blends those external references with company specific inputs. Set against that Fair Ratio of 25.71x, PG&E’s current 14.17x P/E suggests the shares are trading at a discount on this measure.
Result: UNDERVALUED

P/E ratios tell one story, but what if the real opportunity lies elsewhere? Start investing in legacies, not executives. Discover our 23 top founder-led companies.
Upgrade Your Decision Making: Choose your PG&E Narrative
Earlier we mentioned that there is an even better way to understand valuation, so let us introduce you to Narratives, which let you turn your view of PG&E into a clear story that links its business drivers to a financial forecast and then to a fair value estimate.
On Simply Wall St, Narratives sit inside the Community page and give you a simple structure to spell out what you think happens to PG&E’s revenue, earnings and margins, and what you see as a reasonable P/E and discount rate, instead of just accepting a single model output.
Once you or other investors set those assumptions, Narratives calculate a Fair Value that you can compare directly with the current share price to help you decide whether PG&E looks expensive or cheap against your own numbers, not someone else’s.
Narratives also refresh as new information comes in, such as news about wildfire risk initiatives like EMBERPOINT, regulatory updates on cost of capital, or changes to analyst views on future earnings, margins or fair value.
For PG&E today, one investor might build a Narrative close to the higher analyst price target of US$23, another might lean toward the lower US$17 target, and both can see how their different assumptions about growth, wildfire risk, regulation and future P/E feed through to a Fair Value that may or may not line up with the current price around US$16.75.
Do you think there's more to the story for PG&E? Head over to our Community to see what others are saying!
This article by Simply Wall St is general in nature. We provide commentary based on historical data and analyst forecasts only using an unbiased methodology and our articles are not intended to be financial advice. It does not constitute a recommendation to buy or sell any stock, and does not take account of your objectives, or your financial situation. We aim to bring you long-term focused analysis driven by fundamental data. Note that our analysis may not factor in the latest price-sensitive company announcements or qualitative material. Simply Wall St has no position in any stocks mentioned.