Is Primerica (PRI) Pricing Reflect Its Excess Returns Valuation Gap After Recent Gains
Primerica, Inc. PRI | 0.00 |
- If you are wondering whether Primerica's recent share price puts the stock on sale or at a premium, the key question is how that price compares with its underlying value.
- The stock closed at US$276.80, with a 1.1% decline over the last 7 days, a 9.1% gain over 30 days, and returns of 7.0% year to date and 5.5% over the past year.
- Recent coverage has focused on Primerica's positioning within the insurance sector and how investors are weighing its long term track record against current pricing. That context helps frame whether the recent share price moves reflect shifting sentiment or simply normal volatility.
- Right now, Primerica has a value score of 3/6. This suggests the stock screens as undervalued on some checks but not all. That sets up a closer look at traditional valuation approaches and a more comprehensive way to think about what the stock might be worth by the end of this article.
Approach 1: Primerica Excess Returns Analysis
The Excess Returns model looks at how much value a company creates over and above the return that equity investors typically require. Instead of focusing on cash flows, it starts with the book value of equity and estimates how efficiently that equity is expected to earn profits over time.
For Primerica, the model uses a Book Value of US$76.89 per share and a Stable EPS of US$27.72 per share, based on weighted future Return on Equity estimates from 5 analysts. The implied Average Return on Equity is 29.29%, compared with a Cost of Equity of US$6.73 per share. That gap produces an Excess Return of US$20.99 per share, which is then capitalized and added to a Stable Book Value of US$94.65 per share, sourced from weighted future Book Value estimates from 4 analysts.
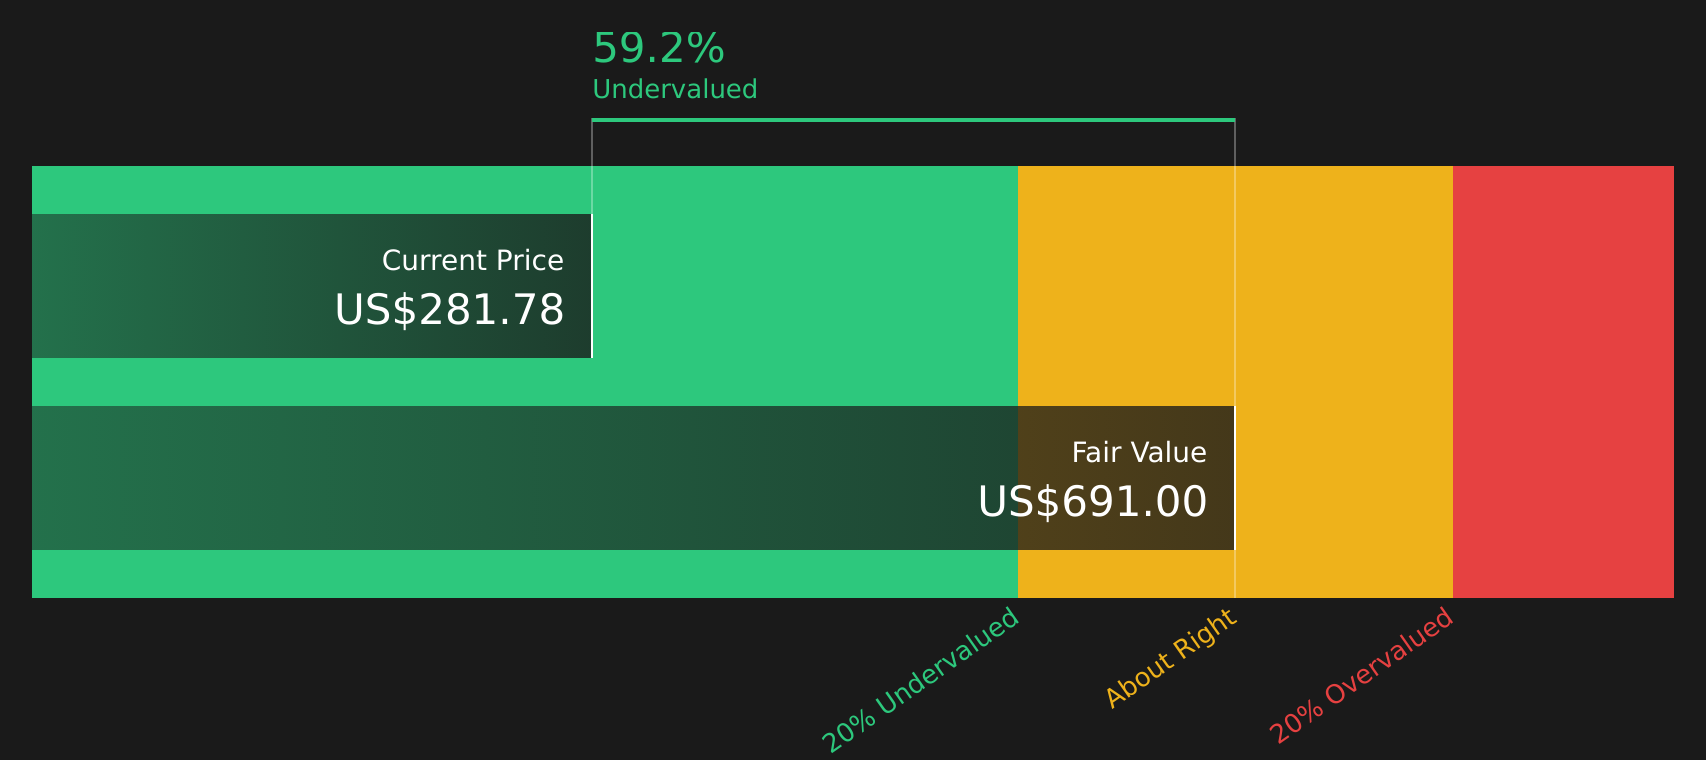
Putting this together, the Excess Returns valuation points to an intrinsic value of about US$683.01 per share. Compared with the recent share price of US$276.80, this implies a 59.5% discount, which suggests the stock screens as significantly undervalued on this model alone.
Result: UNDERVALUED
Our Excess Returns analysis suggests Primerica is undervalued by 59.5%. Track this in your watchlist or portfolio, or discover 44 more high quality undervalued stocks.
Approach 2: Primerica Price vs Earnings
For profitable companies like Primerica, the P/E ratio is a straightforward way to see how much investors are paying for each dollar of earnings. It links the share price directly to profits, which tends to be the main driver of long term value.
What counts as a “normal” P/E ratio depends heavily on expectations for future earnings growth and the risk investors see in those earnings. Higher expected growth or lower perceived risk can justify a higher P/E, while slower growth or higher risk usually points to a lower multiple.
Primerica currently trades on a P/E of 11.61x. That sits close to both the Insurance industry average of 11.37x and the peer average of 12.68x. This suggests the market is broadly aligning Primerica with its sector and comparable companies. Simply Wall St’s Fair Ratio for Primerica is 11.56x. This is a proprietary estimate of the P/E the stock might attract given its earnings growth profile, industry, profit margins, market cap and specific risks. Because it weighs these company level factors, the Fair Ratio can provide a more tailored reference point than a simple peer or industry comparison. With the Fair Ratio at 11.56x and the actual P/E at 11.61x, the stock screens as priced about in line with this model.
Result: ABOUT RIGHT

P/E ratios tell one story, but what if the real opportunity lies elsewhere? Start investing in legacies, not executives. Discover our 19 top founder-led companies.
Upgrade Your Decision Making: Choose your Primerica Narrative
Earlier it was mentioned that there is an even better way to understand valuation. Think of a Narrative as your own clear story for Primerica that connects what you believe about its business and industry to a simple forecast for future revenue, earnings and margins, then to a fair value that you can compare with the current price, all within the Narratives tool on Simply Wall St's Community page where millions of investors share views. With Narratives, you can quickly see whether your fair value is above or below the current share price and use that gap to help decide whether you see the stock as attractive or expensive. The numbers automatically refresh when new earnings, news or company filings are released so your view stays current without extra effort. For Primerica, one investor might build a Narrative close to the more optimistic US$322 price target, leaning on the potential of demographic trends, sales force expansion and digital investments. Another might align with the more cautious US$263 price view, focusing on pressures such as higher expenses, sales force productivity and customer lapses.
Do you think there's more to the story for Primerica? Head over to our Community to see what others are saying!

This article by Simply Wall St is general in nature. We provide commentary based on historical data and analyst forecasts only using an unbiased methodology and our articles are not intended to be financial advice. It does not constitute a recommendation to buy or sell any stock, and does not take account of your objectives, or your financial situation. We aim to bring you long-term focused analysis driven by fundamental data. Note that our analysis may not factor in the latest price-sensitive company announcements or qualitative material. Simply Wall St has no position in any stocks mentioned.