Is Procter & Gamble (PG) Offering A Fresh Entry Point After Recent Share Price Weakness
Procter & Gamble Company PG | 0.00 |
- Wondering whether Procter & Gamble stock offers value at today's price, or if you are better off waiting on the sidelines? This breakdown will help you put the current share price in context.
- The stock last closed at US$141.57, with returns that declined 3.3% over the past week, 1.3% over the past month, and 10.8% over the past year, while the 5 year return sits at 16.5%.
- Recent coverage has focused on how Procter & Gamble fits into consumer staples portfolios and what its long term brand portfolio means for shareholder expectations. This backdrop helps frame why some investors may see recent share price moves as a reassessment of risk and long term resilience rather than a short term swing.
- On Simply Wall St's 6 point valuation checklist, Procter & Gamble scores a 4 out of 6. You can review this in detail in the valuation scorecard. The sections ahead will compare different valuation methods before touching on an even richer way to think about what the stock might be worth.
Approach 1: Procter & Gamble Discounted Cash Flow (DCF) Analysis
A Discounted Cash Flow model takes the cash that a company is expected to generate in the future, then discounts those cash flows back to today to estimate what the business might be worth right now.
For Procter & Gamble, the latest twelve month free cash flow is about $15.59b. Analysts provide explicit forecasts out to 2028, where free cash flow is projected at $16.73b, and Simply Wall St extrapolates these out to 2035 using a 2 stage Free Cash Flow to Equity approach. All figures are assessed in $ and then discounted back using an appropriate required return to shareholders.
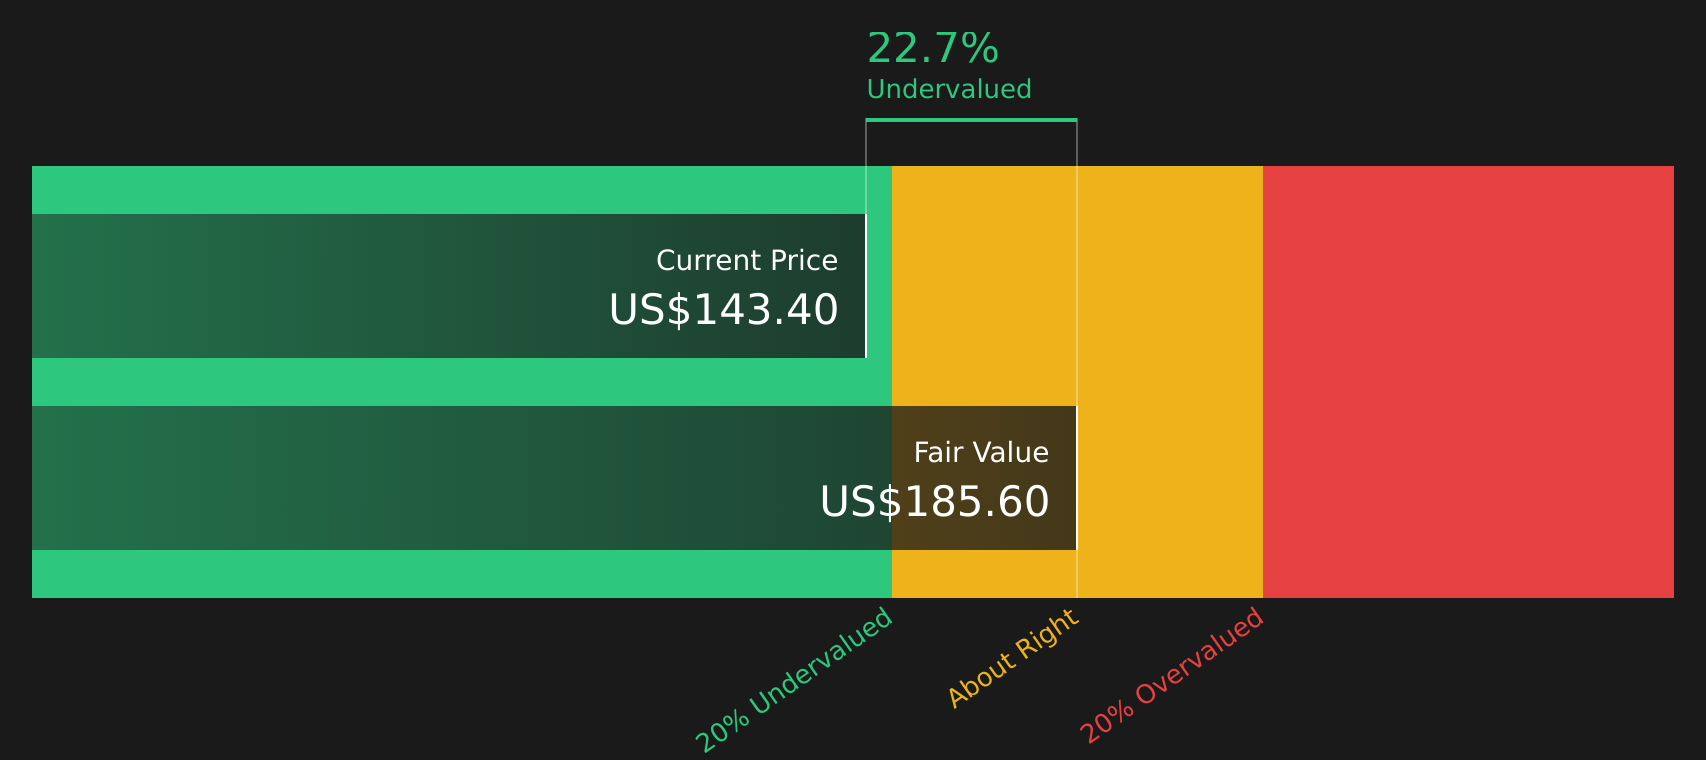
On this basis, the DCF model arrives at an estimated intrinsic value of $185.60 per share, compared with the recent share price of $141.57. That gap equates to an implied discount of 23.7%, which indicates the stock screens as undervalued according to this cash flow view.
Result: UNDERVALUED
Our Discounted Cash Flow (DCF) analysis suggests Procter & Gamble is undervalued by 23.7%. Track this in your watchlist or portfolio, or discover 50 more high quality undervalued stocks.
Approach 2: Procter & Gamble Price vs Earnings
For a profitable company like Procter & Gamble, the P/E ratio is a useful way to think about what you are paying for each dollar of earnings. It ties the share price directly to current earnings, which is often how investors quickly compare established, cash generating businesses.
What counts as a “normal” or “fair” P/E depends on how fast earnings are expected to grow and how risky those earnings are. Higher growth and lower perceived risk can support a higher multiple, while slower growth or higher risk usually point to a lower one.
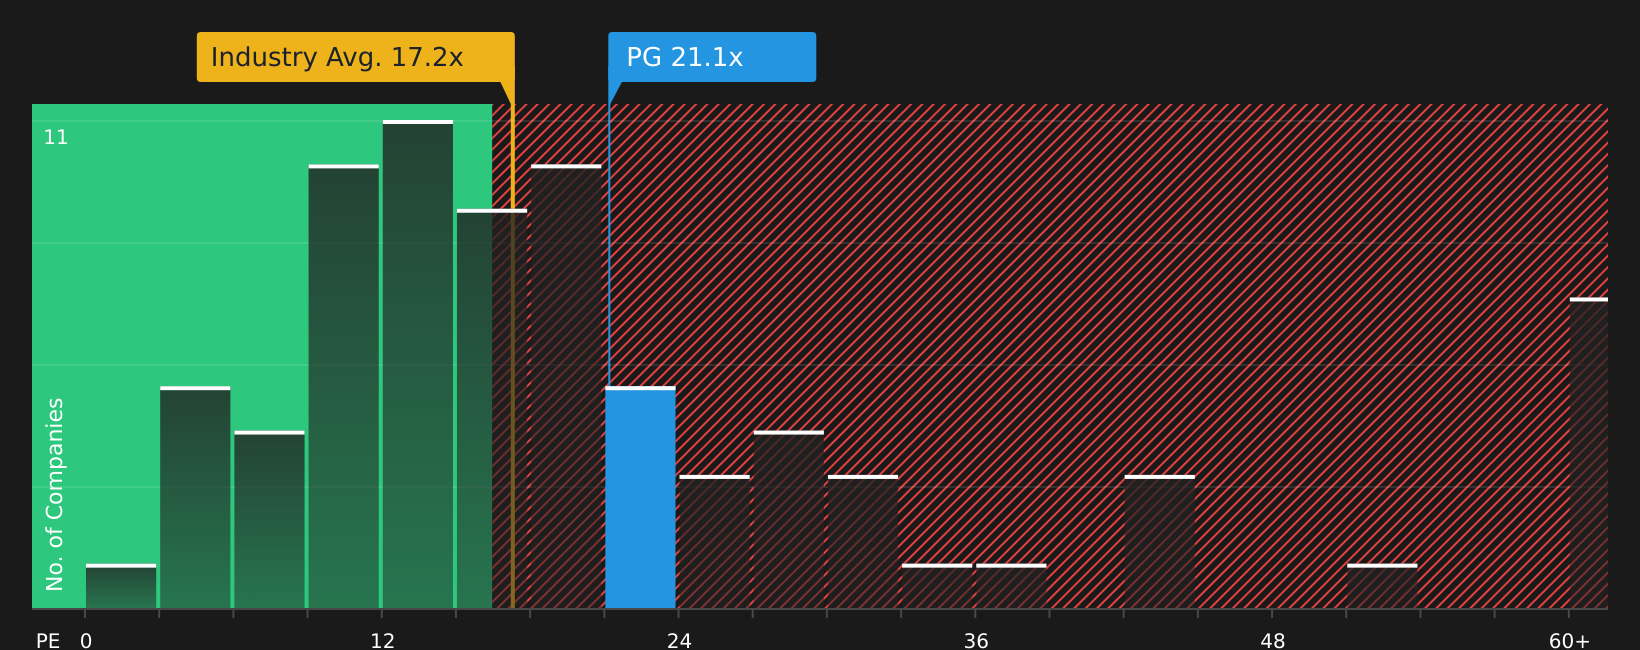
Procter & Gamble currently trades on a P/E of 20.20x. This sits above the Household Products industry average of 17.66x, but below the peer group average of 24.29x. Simply Wall St’s Fair Ratio for Procter & Gamble is 24.15x. The Fair Ratio is a proprietary estimate of what the P/E might be based on factors such as earnings growth, profit margins, industry, market cap and company specific risks. This makes it a more tailored guide than a simple comparison with peers or the broad industry.
Since the current P/E of 20.20x is below the Fair Ratio of 24.15x, the stock screens as undervalued on this earnings multiple view.
Result: UNDERVALUED
P/E ratios tell one story, but what if the real opportunity lies elsewhere? Start investing in legacies, not executives. Discover our 19 top founder-led companies.
Upgrade Your Decision Making: Choose your Procter & Gamble Narrative
Earlier it was mentioned that there is an even better way to understand valuation, so meet Narratives, a simple tool on Simply Wall St’s Community page that lets you attach your story about Procter & Gamble to the numbers. It does this by linking your view on its future revenue, earnings and margins to a financial forecast, a fair value and a clear comparison against today’s share price. This then updates automatically when fresh news or earnings arrive. For example, one investor might build a Procter & Gamble Narrative around long term wellness and brain health trends with a fair value closer to US$185.05 per share. Another might focus on more modest growth assumptions and cost pressures and arrive at a fair value nearer US$121.06. Narratives give you a practical way to decide how the current price lines up with your own expectations rather than relying on a single valuation label.
For Procter & Gamble, however, we will make it really easy for you with previews of two leading Procter & Gamble Narratives:
Fair value: US$150.00 per share
Implied undervaluation vs last close (US$141.57): 5.6%
Revenue growth assumption: 8.09%
- Frames the recent share price pullback and insider selling alongside Simply Wall St and independent fair value estimates clustered around the mid US$100s.
- Highlights a broad portfolio of non food consumer brands with high margins, repeat purchases and a sizeable global footprint.
- Flags leverage, insider selling and recent price weakness as factors to watch while viewing the stock as a candidate for a watchlist.
Fair value: US$121.06 per share
Implied overvaluation vs last close (US$141.57): 16.7%
Revenue growth assumption: 3.32%
- Uses a blend of dividend, cash flow and multiple based models to arrive at a weighted fair value around US$121.06.
- Points to wide moat characteristics, strong returns on capital and solid credit quality, but pairs this with relatively modest projected growth.
- Suggests the current share price sits above the author’s valuation range, with several Monte Carlo simulations indicating a high probability that the stock trades rich to those assumptions.
Both narratives use similar public information yet come to different conclusions. This is the real value of the Community tool: it helps you see how changing your assumptions on growth, margins and required returns can move fair value up or down, and shows where your own view sits relative to other investors.
Do you think there's more to the story for Procter & Gamble? Head over to our Community to see what others are saying!

This article by Simply Wall St is general in nature. We provide commentary based on historical data and analyst forecasts only using an unbiased methodology and our articles are not intended to be financial advice. It does not constitute a recommendation to buy or sell any stock, and does not take account of your objectives, or your financial situation. We aim to bring you long-term focused analysis driven by fundamental data. Note that our analysis may not factor in the latest price-sensitive company announcements or qualitative material. Simply Wall St has no position in any stocks mentioned.