Is Progressive (PGR) Attractive After Recent Share Price Pullback And Mixed Valuation Signals?
Progressive Corporation PGR | 196.59 | -1.49% |
- If you are wondering whether Progressive's current share price offers good value or not, looking at what the market has been willing to pay for the business over time can be a useful starting point.
- Progressive's share price recently closed at US$202.60, with returns of 0.8% over the past 7 days, a 5.8% decline over 30 days, a 4.5% decline year to date, and a 59.2% and 166.3% gain over the past 3 and 5 years respectively.
- Recent attention on Progressive has focused on how its long term performance compares to more recent pullbacks, with investors weighing whether the latest moves reflect changing sentiment or shorter term sector swings. This context is important when thinking about what a fair price might look like today and how much risk the current valuation might imply.
- Simply Wall St currently gives Progressive a valuation score of 5/6, as the company screens as undervalued on five of six checks. Next, we will look at the main valuation approaches behind that score and finish by considering a more complete way to think about what the stock could be worth.
Approach 1: Progressive Excess Returns Analysis
The Excess Returns model looks at how much profit a company can generate over and above the return that shareholders require, then capitalises those extra profits into an estimated value per share.
For Progressive, the starting point is its equity base. Book Value is $51.74 per share and analysts expect this to move toward a Stable Book Value of $72.03 per share, based on estimates from 12 analysts. Using Return on Equity estimates from 11 analysts, Simply Wall St derives a Stable EPS of $18.48 per share.
The model applies a Cost of Equity of $5.03 per share. The difference between Stable EPS and that cost gives an Excess Return of $13.45 per share, which reflects the earnings attributed to returns above the required rate. An Average Return on Equity of 25.65% is used to sustain these excess returns over time in the calculation.
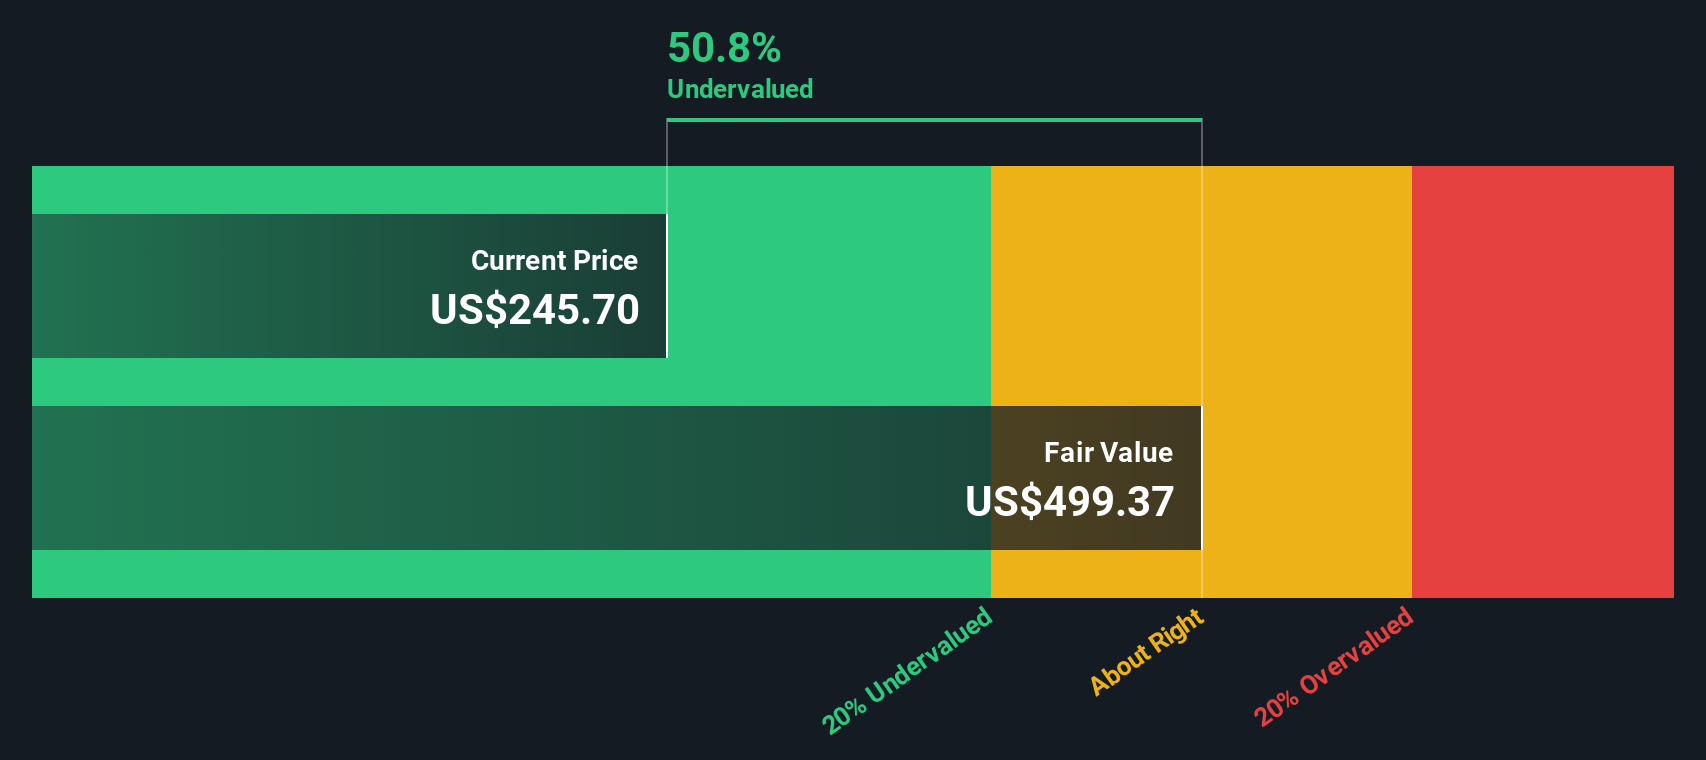
Combining these inputs, the Excess Returns model produces an estimated intrinsic value of about $449 per share. Against the recent share price of $202.60, this implies the stock is 54.9% undervalued based on this approach.
Result: UNDERVALUED
Our Excess Returns analysis suggests Progressive is undervalued by 54.9%. Track this in your watchlist or portfolio, or discover 52 more high quality undervalued stocks.
Approach 2: Progressive Price vs Earnings
For profitable companies, the P/E ratio is a useful shorthand because it links what you pay directly to the earnings the business is currently generating. It gives you a quick sense of how many dollars investors are paying for each dollar of earnings.
What counts as a “normal” or “fair” P/E depends on what investors expect for future earnings and how risky those earnings appear. Higher expected growth or lower perceived risk can justify a higher P/E, while lower expected growth or higher risk usually supports a lower P/E.
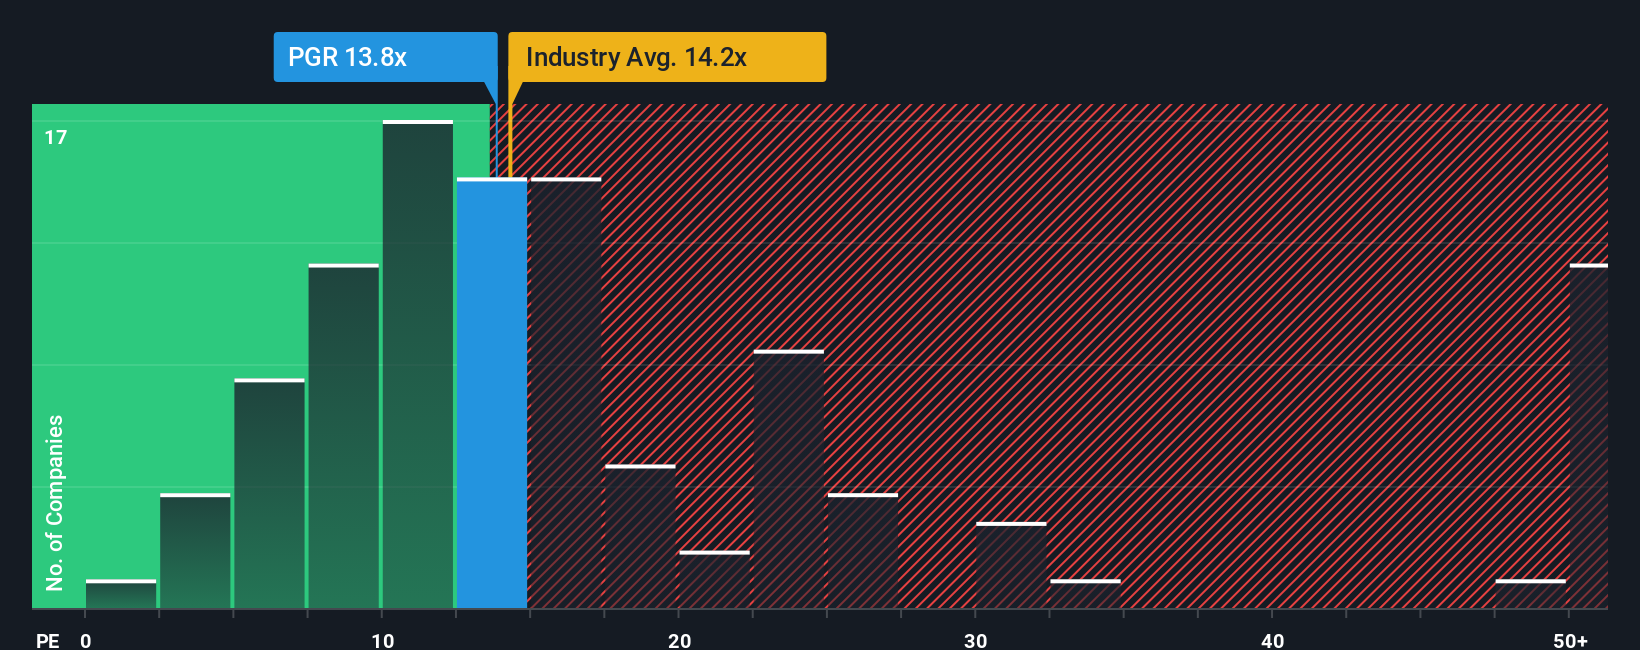
Progressive currently trades on a P/E of 10.50x. That sits below the Insurance industry average P/E of 12.58x and above the peer group average of 8.99x. Simply Wall St also calculates a Fair Ratio of 11.53x, which is its proprietary view of what Progressive’s P/E could look like after considering earnings growth, profit margins, industry, market cap and company specific risks.
Because the Fair Ratio blends these fundamentals rather than just comparing with simple industry or peer averages, it can give a more tailored anchor for assessing valuation. Comparing 11.53x to the current 10.50x indicates that Progressive trades below this Fair Ratio, which points to an undervalued picture on this metric.
Result: UNDERVALUED
P/E ratios tell one story, but what if the real opportunity lies elsewhere? Start investing in legacies, not executives. Discover our 22 top founder-led companies.
Upgrade Your Decision Making: Choose your Progressive Narrative
Earlier we mentioned that there is an even better way to understand valuation, so let us introduce you to Narratives. These are simply your story about Progressive, linked to a set of numbers such as your fair value, revenue, earnings and margin estimates. All of this is built into a forecast that lives on Simply Wall St’s Community page and updates when fresh news or earnings arrive. This allows you to quickly compare your fair value with the current share price and see, for example, why one Progressive Narrative might line up with a higher fair value of about US$302.85 while another points closer to US$191.52. This can help you decide whether the price looks attractive, stretched or somewhere in between, based on the story you believe.
For Progressive however, we will make it really easy for you with previews of two leading Progressive Narratives:
Fair value in this bullish narrative: about US$302.85 per share
Implied undervaluation versus the recent US$202.60 share price: roughly 33.1%
Revenue growth assumption in this narrative: about 6.88% per year
- Analysts in this camp see Progressive's rapid rate adjustments, pricing discipline, and use of telematics as key drivers for revenue growth, policy gains, and higher earnings over several years.
- They expect revenue to reach about US$113.0b and earnings to reach about US$11.6b by around 2028, with earnings per share of US$17.47 and a future P/E of 21.1x, discounted at about 6.8% to arrive at the fair value.
- Risks they flag include climate related losses, changing mobility patterns, regulatory shifts, and technology costs, but they view Progressive's competitive position as strong enough that the bullish price target of US$344.00 still looks reasonable to them.
Fair value in this bearish narrative: about US$191.52 per share
Implied overvaluation versus the recent US$202.60 share price: roughly 5.8%
Revenue growth assumption in this narrative: about 5.46% per year
- Analysts in this group focus on headwinds from a softer property and casualty cycle, rising loss costs, and tougher pricing conditions, which they see as a drag on Progressive's revenue growth and margins over time.
- Their model assumes revenue of about US$104.1b and earnings of about US$8.7b by 2028, with earnings per share of US$14.83 and a future P/E of 15.03x, discounted at around 6.96% to reach a fair value of about US$191.52.
- They acknowledge Progressive's strengths in analytics, branding, and product breadth, but still see the bearish price target of US$215.56 and the updated fair value of US$191.52 as more in line with what softer pricing and margin pressure could mean for the stock.
If you want to see how both of these stories are built number by number, and where your own view sits between them, Curious how numbers become stories that shape markets? Explore Community Narratives.
Do you think there's more to the story for Progressive? Head over to our Community to see what others are saying!

This article by Simply Wall St is general in nature. We provide commentary based on historical data and analyst forecasts only using an unbiased methodology and our articles are not intended to be financial advice. It does not constitute a recommendation to buy or sell any stock, and does not take account of your objectives, or your financial situation. We aim to bring you long-term focused analysis driven by fundamental data. Note that our analysis may not factor in the latest price-sensitive company announcements or qualitative material. Simply Wall St has no position in any stocks mentioned.