Is SS&C Technologies (SSNC) Offering Value After Recent Share Price Weakness?
SS&C Technologies Holdings, Inc. SSNC | 0.00 |
- Wondering whether SS&C Technologies Holdings is attractively priced or just fairly valued at around US$69.29? This article breaks down what that share price could mean for you.
- The stock has moved 3.0% over the last 7 days and 1.4% over the last 30 days, yet is still showing a year to date return of a 19.2% decline and a 1 year return of a 9.7% decline, with a 3 year return of 30.6% and a 5 year return of 0.9%.
- Recent coverage has focused on SS&C Technologies Holdings as a major player in financial and healthcare software and services, and on how the business continues to sit in the broader Professional Services space. This context helps frame why some investors are reassessing the balance between growth potential and risk at the current share price.
- On Simply Wall St's 6 point valuation checklist, SS&C Technologies Holdings scores 4 out of 6. This suggests parts of the market may see value while others remain more cautious. Next, the article will compare different valuation approaches before finishing with a framework that can help you interpret these numbers more clearly.
Approach 1: SS&C Technologies Holdings Discounted Cash Flow (DCF) Analysis
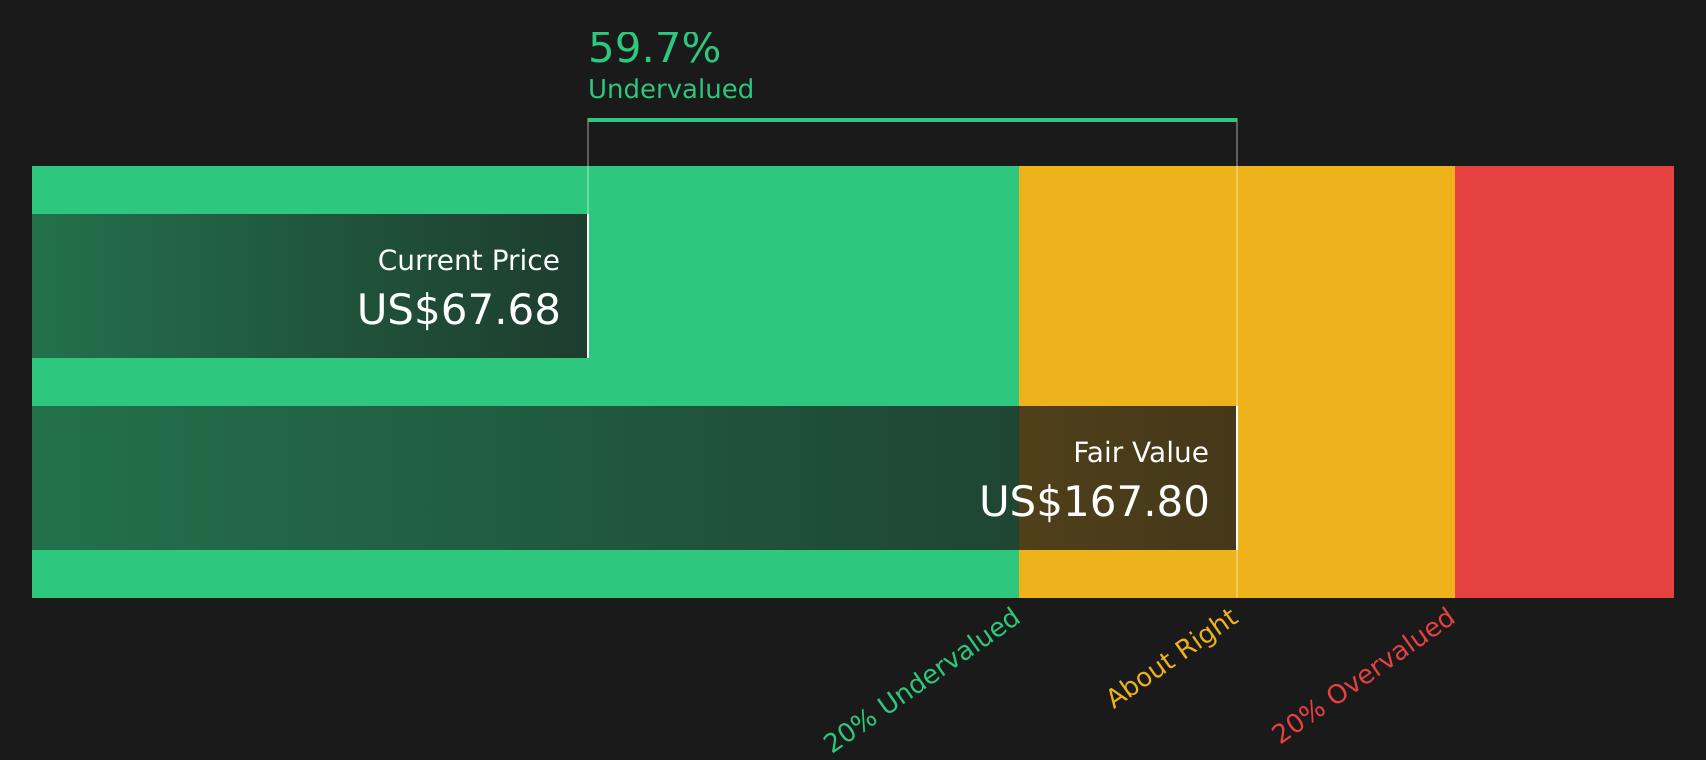
A Discounted Cash Flow, or DCF, model projects a company’s future cash flows and then discounts them back to today’s dollars to estimate what the entire business could be worth at present.
For SS&C Technologies Holdings, the model uses a 2 Stage Free Cash Flow to Equity approach based on cash flow projections. The latest twelve month free cash flow is about $1.48b. Analyst and extrapolated estimates include free cash flow figures such as $1.64b in 2026 and $2.13b in 2030, all in $. Simply Wall St uses analyst estimates for the early years and then extends those trends further out to complete the 10 year path.
When these projected cash flows are discounted back and summed, the model arrives at an estimated intrinsic value of about $161.94 per share. Compared with a current share price around $69.29, this suggests an intrinsic discount of roughly 57.2%, indicating that the shares are trading at a substantial discount to this cash flow based estimate.
Result: UNDERVALUED
Our Discounted Cash Flow (DCF) analysis suggests SS&C Technologies Holdings is undervalued by 57.2%. Track this in your watchlist or portfolio, or discover 50 more high quality undervalued stocks.
Approach 2: SS&C Technologies Holdings Price vs Earnings
For a profitable business like SS&C Technologies Holdings, the P/E ratio is a useful way to relate what you pay per share to the earnings the company is generating today. Investors often accept a higher P/E when they expect stronger earnings growth or see less risk, and look for a lower P/E when growth expectations are more modest or risks are higher.
SS&C Technologies Holdings is currently trading on a P/E of about 20.6x. That sits above the Professional Services industry average of roughly 19.6x and also above the peer group average of about 13.9x. Simply comparing to peers and the industry could make the shares look relatively expensive.
Simply Wall St also provides a proprietary “Fair Ratio” of 24.5x, which is the P/E level that might be expected after considering factors such as earnings growth, profit margins, industry, market cap and company specific risks. This tailored view can be more informative than simple peer or sector comparisons because it adjusts for differences in quality and risk. With the current P/E of 20.6x below the Fair Ratio of 24.5x, the shares screen as undervalued on this earnings based measure.
Result: UNDERVALUED

P/E ratios tell one story, but what if the real opportunity lies elsewhere? Start investing in legacies, not executives. Discover our 17 top founder-led companies.
Upgrade Your Decision Making: Choose your SS&C Technologies Holdings Narrative
Earlier it was mentioned that there is an even better way to think about valuation. Meet Narratives, a simple tool on Simply Wall St’s Community page that lets you spell out your story for SS&C Technologies Holdings, link it to a forecast for revenue, earnings and margins, and see what fair value that story implies. The platform then keeps your view updated when new news or earnings arrive, so you can compare your fair value to the current price and decide whether SS&C looks interesting to you at around US$68.63, depending on whether you lean closer to the more cautious US$78 view or the more optimistic US$115 view.
Do you think there's more to the story for SS&C Technologies Holdings? Head over to our Community to see what others are saying!

This article by Simply Wall St is general in nature. We provide commentary based on historical data and analyst forecasts only using an unbiased methodology and our articles are not intended to be financial advice. It does not constitute a recommendation to buy or sell any stock, and does not take account of your objectives, or your financial situation. We aim to bring you long-term focused analysis driven by fundamental data. Note that our analysis may not factor in the latest price-sensitive company announcements or qualitative material. Simply Wall St has no position in any stocks mentioned.