

Is Stifel Financial (SF) Undervalued Or Is Its Rebound Already Priced In?
Stifel Financial Corp SF | 0.00 |
Stifel Financial (SF) drew investor attention after its latest market close at $80.96, with recent returns reflecting a mix of short-term weakness and longer-term gains over the past month and the past three months.
Over the past year, Stifel Financial has seen its share price return soften year to date, while its 90 day share price return of 11.53% and 1 year total shareholder return of 8.07% suggest that momentum has been steadier over a longer window.
If this kind of mixed momentum has you thinking about where else to put fresh capital to work, it could be a good moment to check out 19 top founder-led companies
Stifel Financial now trades at a discount to analyst targets even after its recent rebound, while modelled intrinsic value points the other way. Is the market showing sensible caution, or mispricing the stock’s earnings power?
Most Popular Narrative: 9% Undervalued
With Stifel Financial shares at $80.96 against a narrative fair value of $89.00, the gap reflects a detailed earnings and margin story, not just sentiment.
The ongoing investment in technology and adviser productivity tools is positioned to strengthen Stifel’s Global Wealth Management segment, potentially improving net margins by increasing efficiency and delivering tailored advice, enhancing future asset growth and stability.
Read the complete narrative. Read the complete narrative.
Want to see what underpins that valuation gap for Stifel Financial? The narrative focuses on revenue trends, margins, and an earnings multiple relative to the wider sector. It outlines the profit and cash flow paths that are used to support the $89.00 fair value figure.
Result: Fair Value of $89.00 (UNDERVALUED)
However, Stifel Financial’s story still carries real risk, particularly if legal costs stay elevated or if market volatility continues to weigh on client activity and loan demand.
Another View on Stifel Financial’s Valuation
The narrative fair value for Stifel Financial at $89.00 leans on earnings and margins, yet the SWS DCF model tells a different story. On that framework, the stock at $80.96 sits well above an estimated future cash flow value of $42.42, which points to an overvalued result instead. Which lens do you trust more for your own work?
For a closer look at how this cash flow view is built step by step, it can be helpful to walk through the full set of assumptions that sit behind the SWS DCF model. Look into how the SWS DCF model arrives at its fair value.
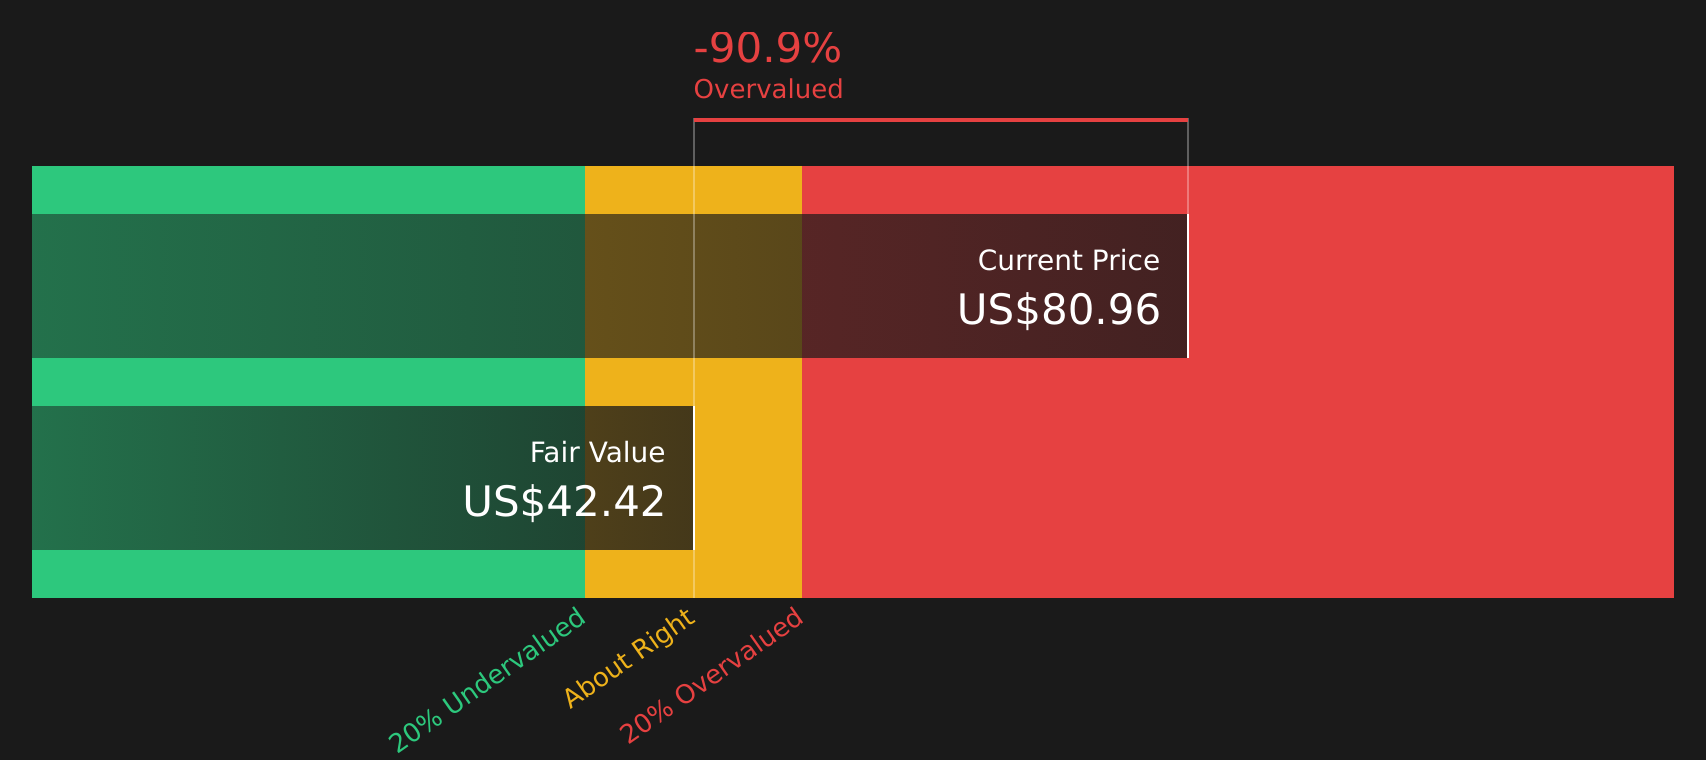
Simply Wall St performs a discounted cash flow (DCF) on every stock in the world every day (check out Stifel Financial for example). We show the entire calculation in full. You can track the result in your watchlist or portfolio and be alerted when this changes, or use our stock screener to discover 48 high quality undervalued stocks. If you save a screener we even alert you when new companies match - so you never miss a potential opportunity.
Next Steps
Encouraged by the mix of views on Stifel Financial so far, or more cautious about what the numbers really imply? Act while the story is front of mind and review the full breakdown of potential upsides in the 4 key rewards.
Looking for more investment ideas beyond Stifel Financial?
If Stifel Financial has sharpened your focus on opportunities, do not stop here. Use the Simply Wall St screener to spot other stocks that might better fit your goals.
- Target potential mispricings by reviewing companies that look attractively valued on both quality and fundamentals through the 48 high quality undervalued stocks.
- Prioritise resilience by checking stocks that show stronger balance sheets and fundamentals in the solid balance sheet and fundamentals stocks screener (50 results).
- Hunt for lesser known opportunities by scanning the screener containing 17 high quality undiscovered gems before other investors catch on.
This article by Simply Wall St is general in nature. We provide commentary based on historical data and analyst forecasts only using an unbiased methodology and our articles are not intended to be financial advice. It does not constitute a recommendation to buy or sell any stock, and does not take account of your objectives, or your financial situation. We aim to bring you long-term focused analysis driven by fundamental data. Note that our analysis may not factor in the latest price-sensitive company announcements or qualitative material. Simply Wall St has no position in any stocks mentioned.