Is TD SYNNEX (SNX) Pricing Reflect Its Cash Flow And Earnings Potential Today
TD SYNNEX Corporation SNX | 186.92 | +0.34% |
- If you are asking whether TD SYNNEX is priced attractively today, the starting point is to look calmly at what the current market price might already be assuming.
- The stock last closed at US$158.67, with returns of 3.6% over 7 days, 3.4% over 30 days, 3.4% year to date, 12.8% over 1 year, 57.6% over 3 years and 92.9% over 5 years. This gives you a clear snapshot of how the market has treated the shares over different time frames.
- Recent coverage has focused on TD SYNNEX in the context of broader technology distribution and IT services discussions, including how large distributors are positioned in the current tech cycle. This kind of commentary helps frame whether the share price moves are being driven by company specific factors or by broader sector sentiment.
- On our valuation checks, TD SYNNEX scores 5 out of 6 for being potentially undervalued. This sets up a closer look at how different valuation methods line up, and later in the article we will also look at a more holistic way to think about what that score really means for you.
Approach 1: TD SYNNEX Discounted Cash Flow (DCF) Analysis
A Discounted Cash Flow, or DCF, looks at the cash TD SYNNEX is expected to generate in the future and discounts those projections back to what they might be worth in $ today.
TD SYNNEX last reported trailing twelve month free cash flow of about $1.37b. Using a 2 Stage Free Cash Flow to Equity model, analysts provide explicit forecasts through 2028, with Simply Wall St extrapolating further out. For example, projected free cash flow in 2028 is $1.34b, and the model extends those estimates out to 2035 with gradually changing annual figures, all discounted back to present value.
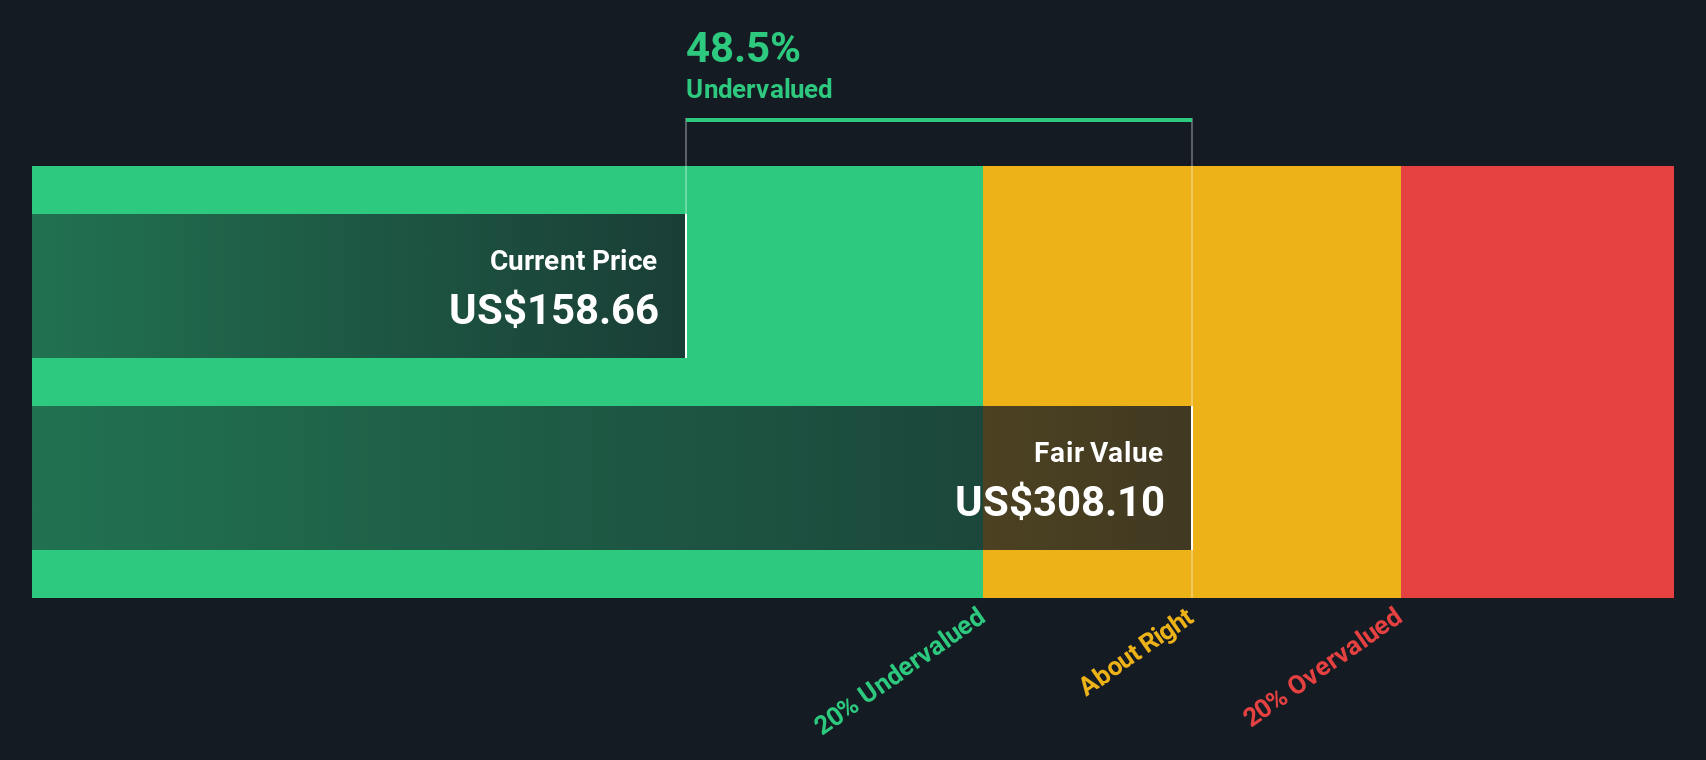
When you add up these discounted cash flows, the model arrives at an estimated intrinsic value of about $240.48 per share. Against the recent share price of US$158.67, this implies the stock trades at roughly a 34.0% discount to that DCF estimate, which indicates potential undervaluation on this specific cash flow view.
Result: UNDERVALUED
Our Discounted Cash Flow (DCF) analysis suggests TD SYNNEX is undervalued by 34.0%. Track this in your watchlist or portfolio, or discover 875 more undervalued stocks based on cash flows.
Approach 2: TD SYNNEX Price vs Earnings
For a profitable company like TD SYNNEX, the P/E ratio is a useful shorthand for what the market is currently willing to pay for each dollar of earnings. It reflects both what investors expect from future earnings and how much risk they feel they are taking on.
In simple terms, stronger growth expectations and lower perceived risk usually support a higher, or more generous, P/E, while lower growth and higher risk usually line up with a lower, or more cautious, P/E. That is why looking at the raw multiple on its own rarely tells the full story.
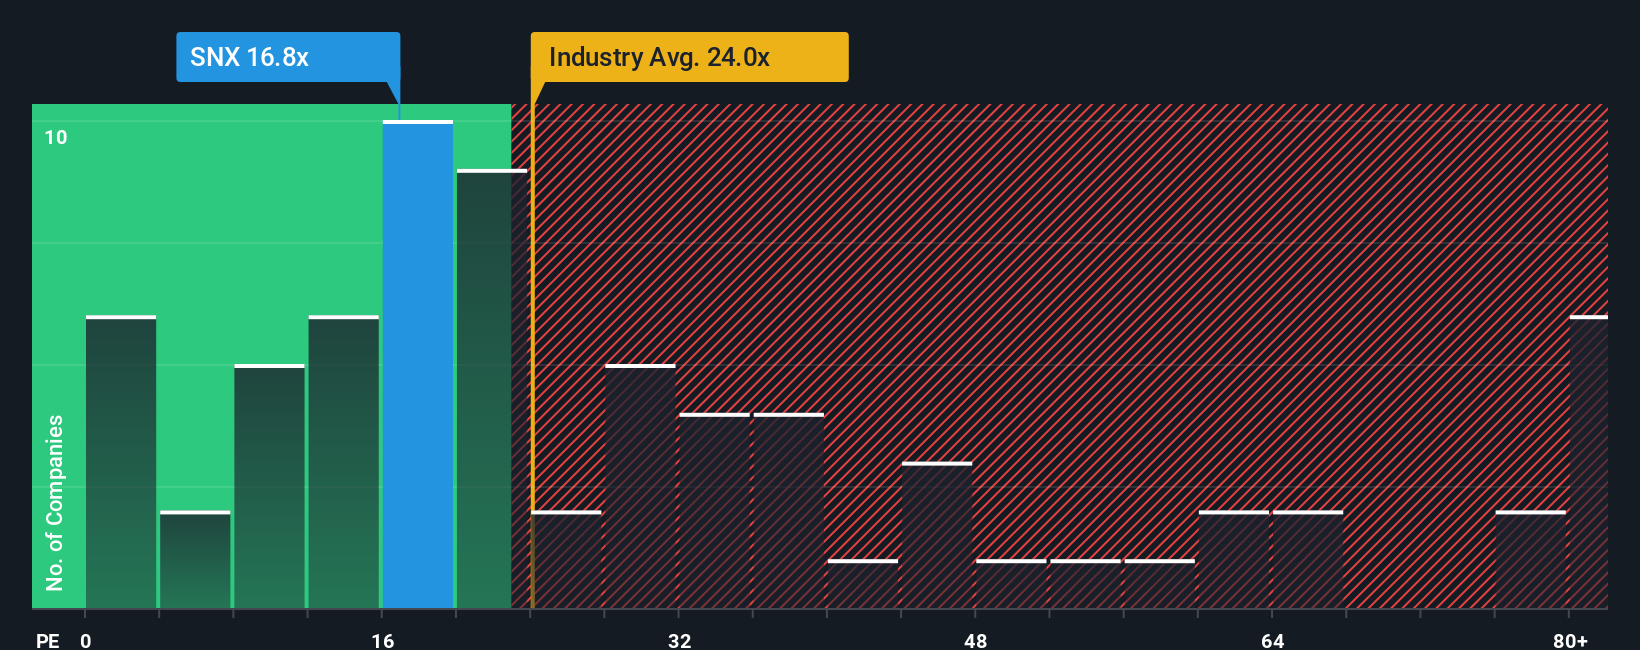
TD SYNNEX currently trades on a P/E of 15.62x. That sits below the Electronic industry average of 26.61x and below the peer group average of 17.94x. Simply Wall St also calculates a “Fair Ratio” for TD SYNNEX of 23.49x. This Fair Ratio is a proprietary estimate of what the P/E might be, given factors like earnings growth, profit margins, industry, market cap and company specific risks, so it can be more tailored than a simple peer or industry comparison.
Comparing the Fair Ratio of 23.49x with the current P/E of 15.62x suggests TD SYNNEX shares are trading at a discount on this earnings based view.
Result: UNDERVALUED
P/E ratios tell one story, but what if the real opportunity lies elsewhere? Discover 1426 companies where insiders are betting big on explosive growth.
Upgrade Your Decision Making: Choose your TD SYNNEX Narrative
Earlier we mentioned that there is an even better way to understand valuation. Let us introduce you to Narratives, which are simply your story about a company linked directly to your assumptions for fair value, future revenue, earnings and margins.
On Simply Wall St, Narratives sit on the Community page and give you an easy way to connect the TD SYNNEX story you believe to a financial forecast, then to a fair value that you can compare with the current share price to help decide whether you are closer to buying, holding or selling.
Because Narratives update automatically when fresh information like news or earnings is added to the platform, your fair value view for TD SYNNEX can stay aligned with what is happening without you rebuilding a model each time.
For example, one TD SYNNEX Narrative might assume higher long term margins and arrive at a much higher fair value, while another more cautious Narrative could use flatter margins and a higher discount rate and therefore sit at the lower end of fair values shared by the community.
Do you think there's more to the story for TD SYNNEX? Head over to our Community to see what others are saying!

This article by Simply Wall St is general in nature. We provide commentary based on historical data and analyst forecasts only using an unbiased methodology and our articles are not intended to be financial advice. It does not constitute a recommendation to buy or sell any stock, and does not take account of your objectives, or your financial situation. We aim to bring you long-term focused analysis driven by fundamental data. Note that our analysis may not factor in the latest price-sensitive company announcements or qualitative material. Simply Wall St has no position in any stocks mentioned.