Is Teradata (TDC) Offering An Opportunity After Multi Year Share Price Weakness
Teradata Corporation TDC | 26.67 26.67 | +3.69% 0.00% Post |
- If you are wondering whether Teradata's share price reflects its true worth or if the market is missing something, you are in the right place for a closer look at value.
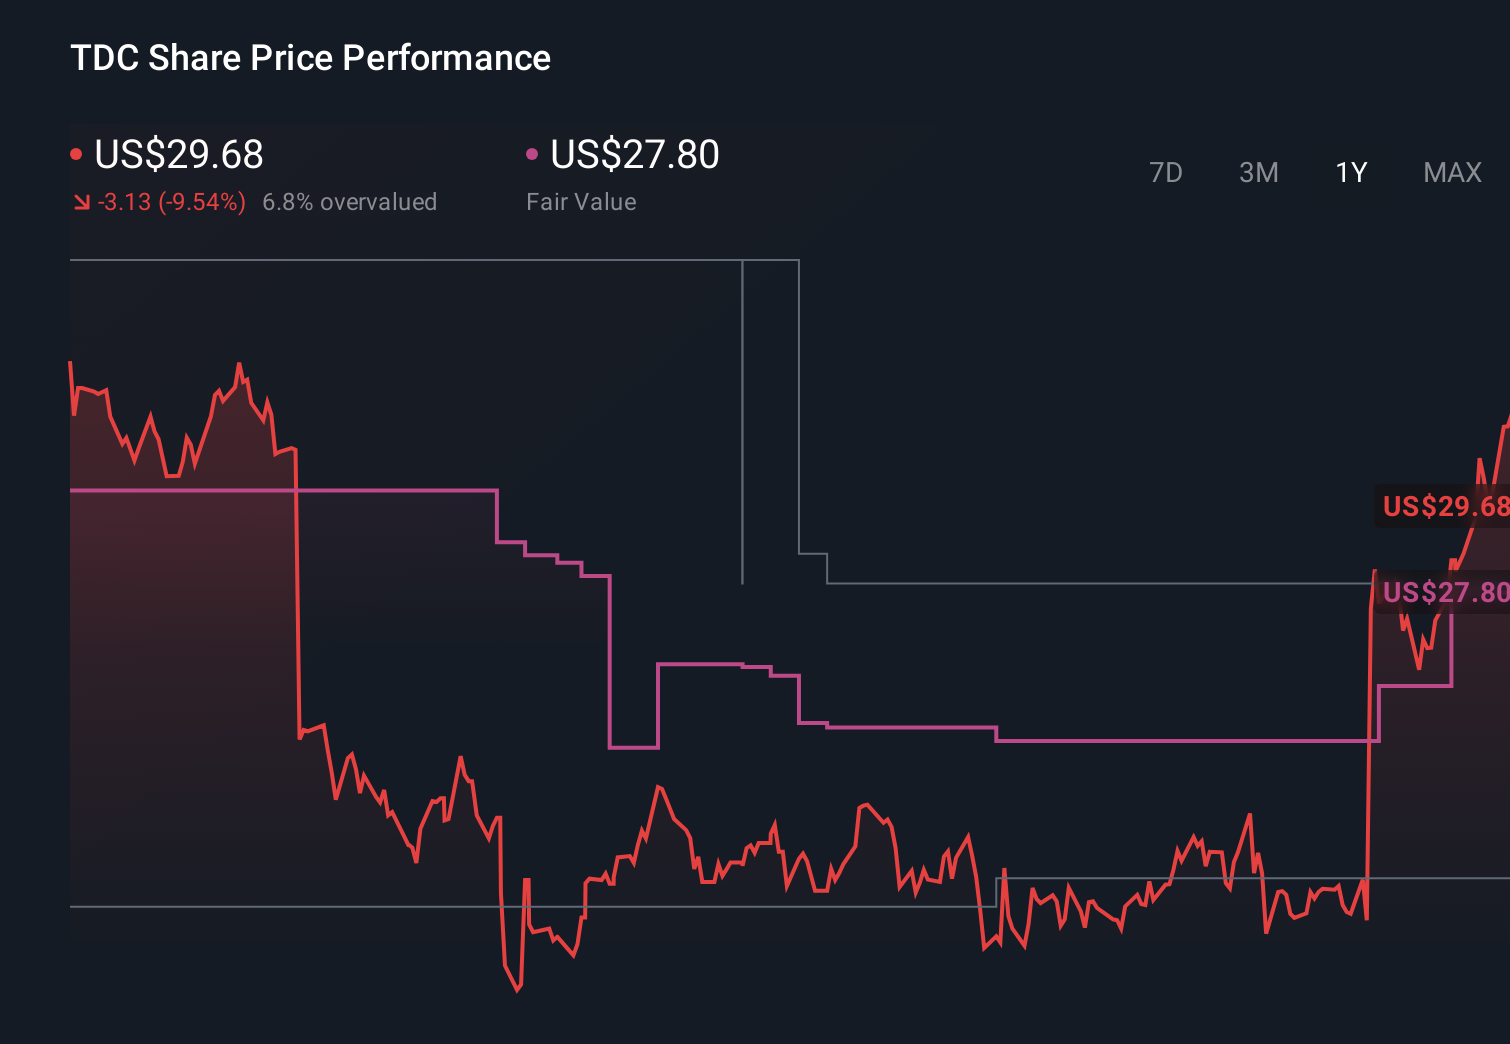
- The stock last closed at US$27.47, with returns of a 3.7% decline over 7 days, 13.5% decline over 30 days, 7.5% decline year to date, 11.0% decline over 1 year, 19.8% decline over 3 years and 44.3% decline over 5 years.
- Recent coverage has focused on how Teradata positions itself as a data and analytics provider in a crowded software space, along with how its product mix and customer relationships are evolving. This context helps frame why the share price has moved the way it has and why investors are paying close attention to how the business is valued.
- On our valuation checks, Teradata scores 5 out of 6 for being assessed as undervalued, giving it a value score of 5. Next, we will walk through the main valuation approaches investors often use, before finishing with a more complete way to think about what that score really means.
Approach 1: Teradata Discounted Cash Flow (DCF) Analysis
A Discounted Cash Flow model looks at the cash Teradata is expected to generate in the future, then discounts those projected cash flows back to today to estimate what the entire business might be worth right now.
For Teradata, the model used is a 2 Stage Free Cash Flow to Equity approach. The last twelve months free cash flow is about $280.4 million. Analyst estimates and extrapolated figures then project free cash flow rising to about $615.5 million in 2035, with interim points such as $293.7 million in 2026, $322.3 million in 2027 and $390.0 million in 2028, all in dollar terms and discounted back to today.
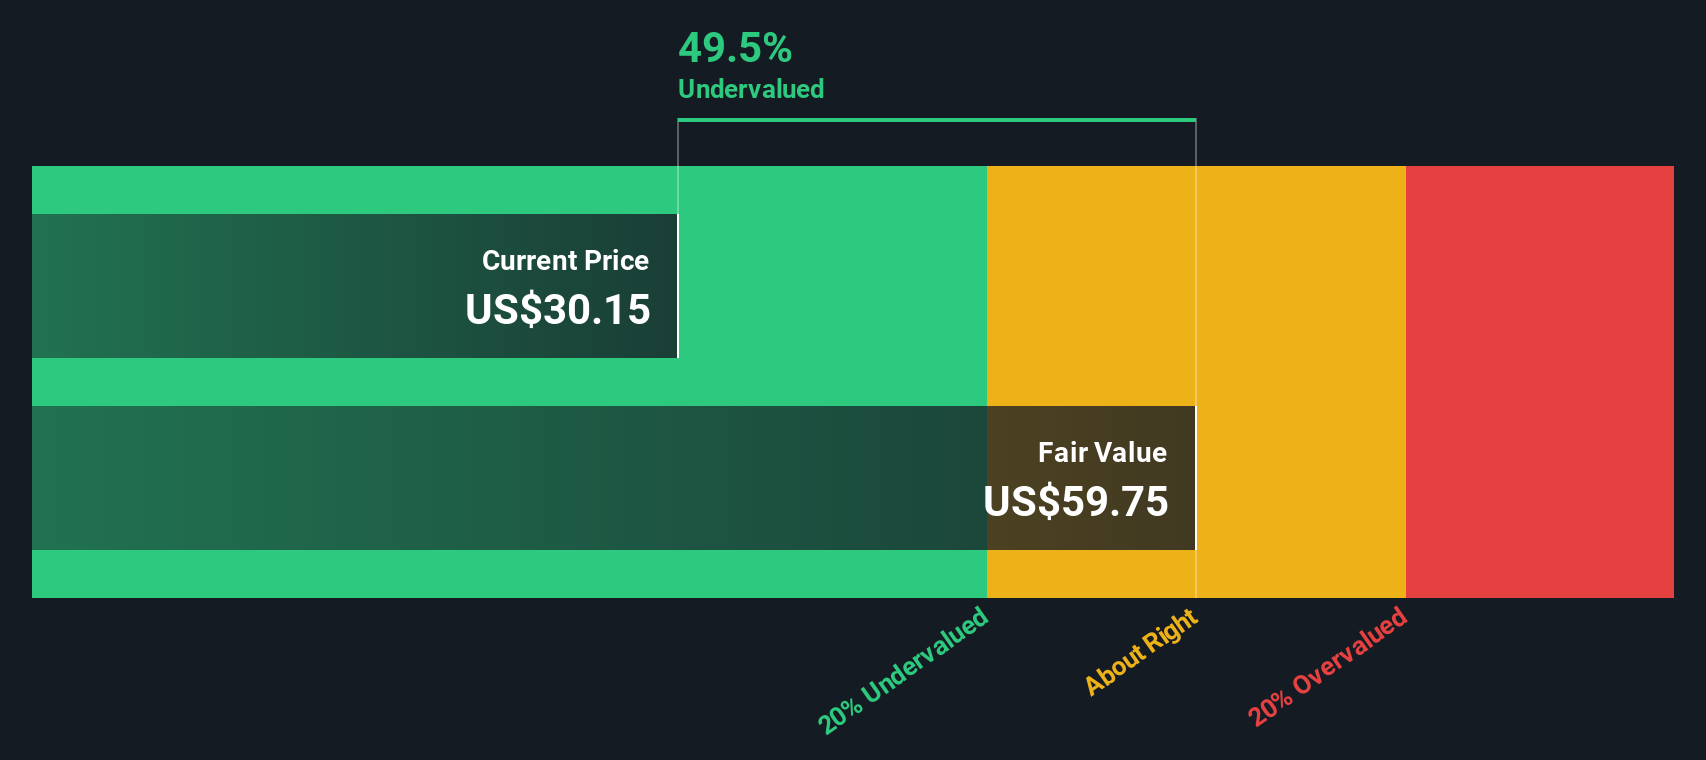
Adding these discounted cash flows together, plus a terminal value, gives an estimated intrinsic value of about $82.29 per share. Compared with the recent share price of US$27.47, the model output implies the stock is around 66.6% undervalued on this DCF view.
Result: UNDERVALUED
Our Discounted Cash Flow (DCF) analysis suggests Teradata is undervalued by 66.6%. Track this in your watchlist or portfolio, or discover 53 more high quality undervalued stocks.
Approach 2: Teradata Price vs Earnings
For profitable companies like Teradata, the P/E ratio is a common way to think about value because it links what you pay for each share to the earnings the business is currently generating. Investors usually accept higher P/E ratios when they expect stronger earnings growth or see the business as lower risk, and lower P/E ratios when growth expectations or perceived risk are less favorable.
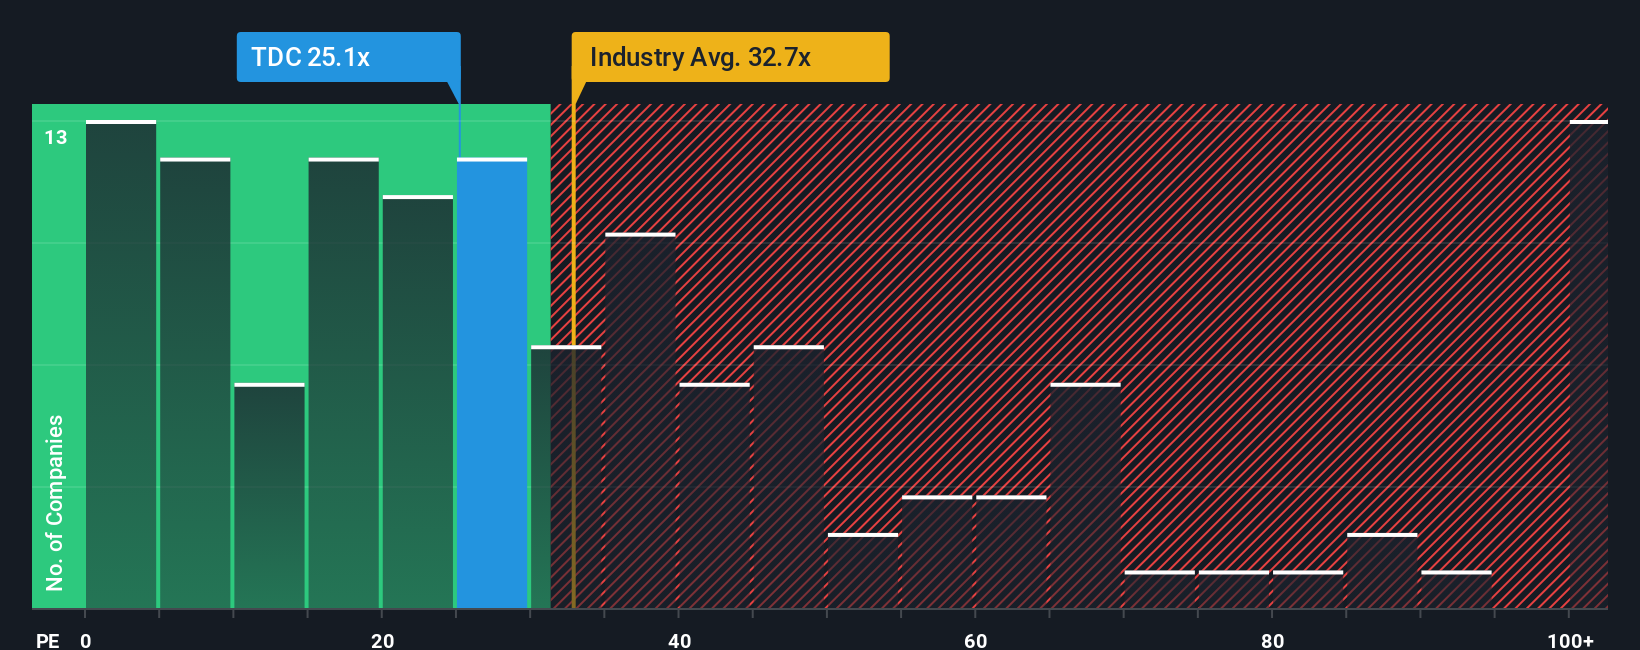
Teradata currently trades on a P/E of about 21.7x. That sits below the Software industry average of roughly 26.9x and the peer group average of about 26.3x. Simply Wall St also calculates a proprietary “Fair Ratio” for Teradata of 25.2x, which reflects factors such as its earnings growth profile, industry, profit margins, market cap and company specific risks.
This Fair Ratio is designed to be more tailored than a simple comparison against peers or the broad industry because it adjusts for Teradata’s own characteristics rather than assuming all Software names should trade on the same multiple. Comparing the Fair Ratio of 25.2x with the current P/E of 21.7x suggests Teradata’s shares are undervalued on this P/E based view.
Result: UNDERVALUED
P/E ratios tell one story, but what if the real opportunity lies elsewhere? Start investing in legacies, not executives. Discover our 22 top founder-led companies.
Upgrade Your Decision Making: Choose your Teradata Narrative
Earlier we mentioned that there is an even better way to understand valuation, so let us introduce you to Narratives, which Simply Wall St hosts on its Community page used by millions of investors.
A Narrative is your story for a company, where you set your own view of Teradata’s future revenue, earnings and profit margins, then link that to a forecast and a fair value that sits behind the share price chart you see.
Instead of only looking at ratios like P/E, a Narrative connects three pieces: what you think Teradata’s business story looks like over time, how that flows through a financial model, and the fair value that falls out of those assumptions.
Narratives help you decide whether Teradata looks attractive or expensive by comparing your Fair Value to the current share price, and they update automatically when new information such as earnings releases or company news is added to the platform.
For example, one Teradata Narrative might reflect an optimistic view with higher revenue and margin assumptions that support a Fair Value far above the current price, while another could be far more cautious, with lower growth and margins leading to a Fair Value well below where the shares trade today.
Do you think there's more to the story for Teradata? Head over to our Community to see what others are saying!
This article by Simply Wall St is general in nature. We provide commentary based on historical data and analyst forecasts only using an unbiased methodology and our articles are not intended to be financial advice. It does not constitute a recommendation to buy or sell any stock, and does not take account of your objectives, or your financial situation. We aim to bring you long-term focused analysis driven by fundamental data. Note that our analysis may not factor in the latest price-sensitive company announcements or qualitative material. Simply Wall St has no position in any stocks mentioned.