Is Terex (TEX) Offering Value After Strong Multi Year Share Price Gains
Terex Corporation TEX | 58.52 | -2.92% |
- If you have been wondering whether Terex stock is offering good value right now, the numbers behind its current price can tell you a lot about what you are really paying for.
- Terex recently closed at US$60.47, with returns of 2.5% over the last 7 days, 9.6% over the last month, 9.9% year to date and 30.3% over the last year, as well as 23.4% over 3 years and 76.6% over 5 years. These figures may shape how investors view both potential upside and risk today.
- Recent coverage around Terex has focused on the company as an established player in capital goods. This keeps attention on how it is positioned in its industry rather than on short term trading alone. This kind of context helps frame whether the recent share price performance aligns with the broader narrative around the business.
- On our checklist of 6 valuation tests, Terex scores 5 out of 6. The rest of this article will walk through what different valuation approaches say about that score and point you to an even better way to make sense of Terex's value at the end.
Approach 1: Terex Discounted Cash Flow (DCF) Analysis
A Discounted Cash Flow, or DCF, model estimates what a company could be worth by projecting its future cash flows and then discounting those cash flows back to today, using the idea that money available now is worth more than the same amount later.
For Terex, the model used is a 2 Stage Free Cash Flow to Equity approach, built on cash flow projections in US$. The latest twelve month free cash flow is US$282.2 million. The model then projects Terex’s free cash flow out to at least 2035, with one example point being US$351.4 million in 2026. Later years are extended using Simply Wall St’s own assumptions once analyst data runs out.
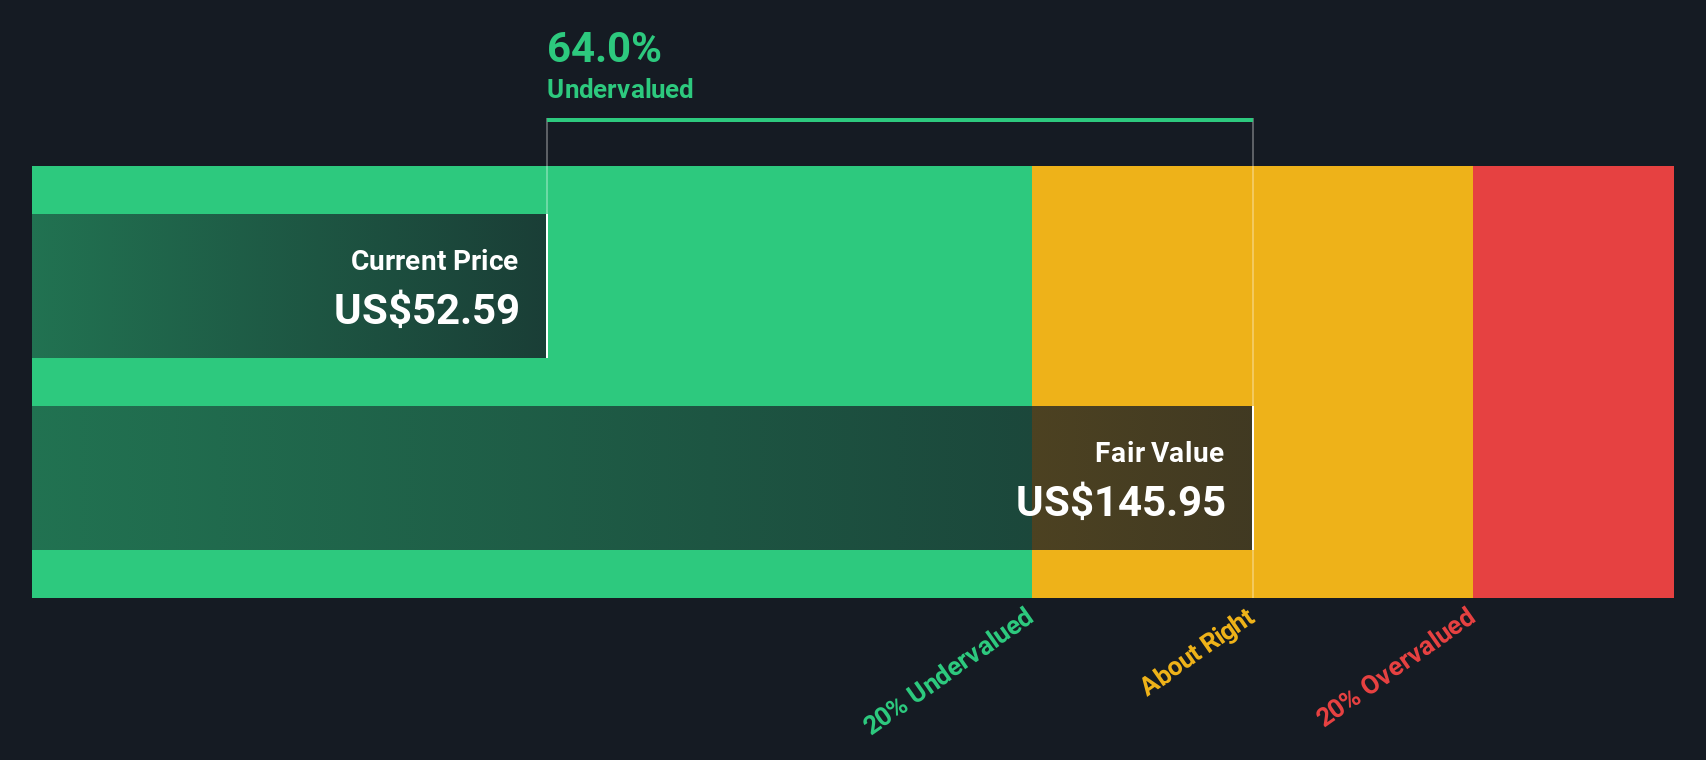
When those projected cash flows are discounted back to today and added together, the model arrives at an estimated intrinsic value of US$98.17 per share. Against the recent share price of US$60.47, this implies a 38.4% discount, which indicates that Terex is trading below this DCF based estimate of value.
Result: UNDERVALUED
Our Discounted Cash Flow (DCF) analysis suggests Terex is undervalued by 38.4%. Track this in your watchlist or portfolio, or discover 876 more undervalued stocks based on cash flows.
Approach 2: Terex Price vs Earnings
For a profitable company, the P/E ratio is a straightforward way to think about what you are paying for each dollar of current earnings. It helps you quickly compare how the market is pricing those earnings against other companies.
What counts as a "normal" or "fair" P/E usually reflects how quickly earnings are expected to grow and how risky those earnings are. Higher expected growth and lower perceived risk often support a higher P/E, while slower growth or higher uncertainty usually align with a lower P/E.
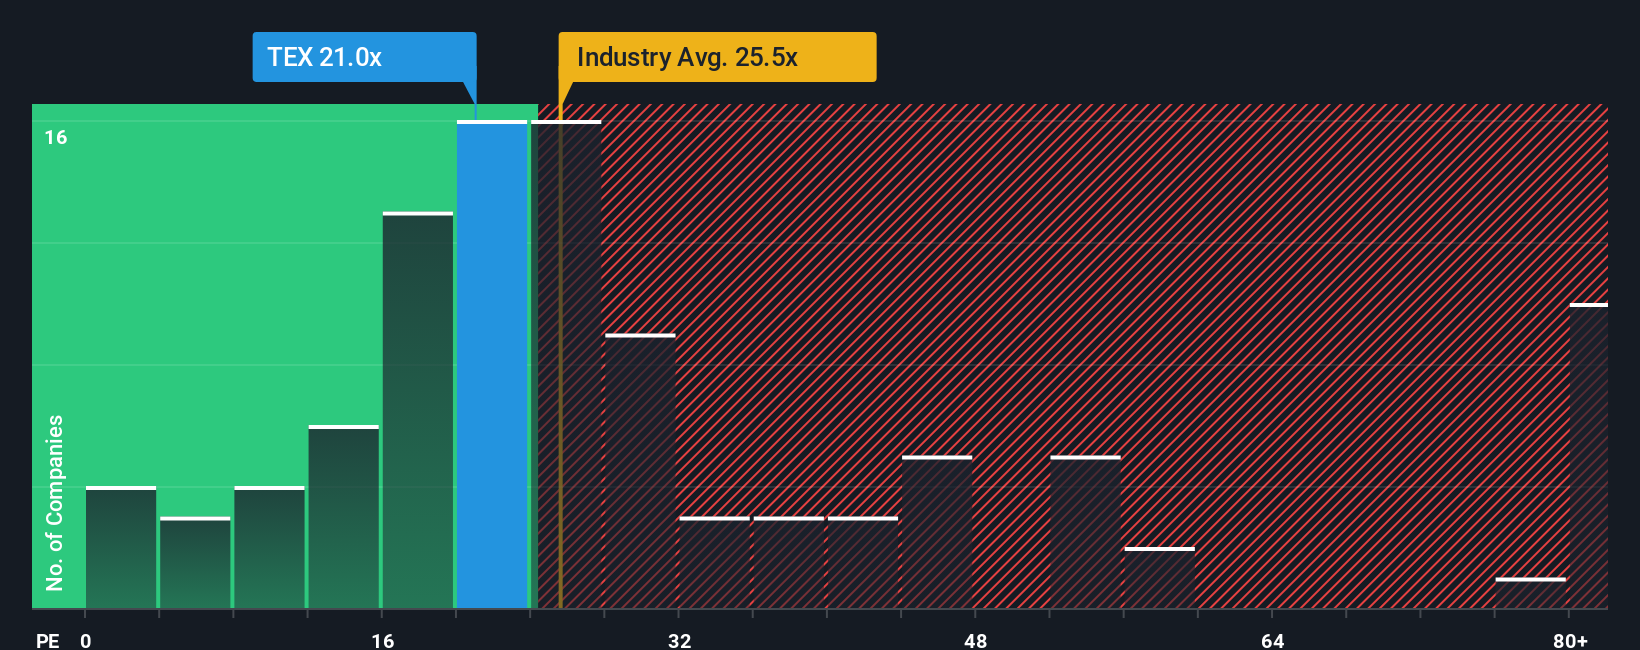
Terex currently trades on a P/E of 25.43x. That sits below the Machinery industry average P/E of 27.69x and is also below the selected peer average of 27.25x. Simply Wall St then goes a step further with its proprietary “Fair Ratio”, which estimates what P/E might make sense for Terex given factors such as its earnings growth profile, profit margins, industry, market capitalization and company specific risks.
Because this Fair Ratio of 32.20x is tailored to Terex rather than just broad peer or industry groups, it can be a more targeted gauge of value. Comparing the Fair Ratio with the current P/E suggests the shares are priced below that company specific reference point.
Result: UNDERVALUED
P/E ratios tell one story, but what if the real opportunity lies elsewhere? Discover 1422 companies where insiders are betting big on explosive growth.
Upgrade Your Decision Making: Choose your Terex Narrative
Earlier we mentioned that there is an even better way to understand valuation, so let us introduce you to Narratives, a simple way to connect your view of Terex with the numbers behind it.
A Narrative is your story about the company, where you spell out what you think is a reasonable fair value and how you expect revenue, earnings and margins to play out over time, instead of only looking at a single ratio like P/E.
On Simply Wall St, Narratives sit in the Community page and link that story to a full financial forecast. This then flows through to an implied fair value, which you can compare with the current share price to help you decide whether Terex looks appealing, fully priced or unattractive right now.
Because Narratives on the platform are updated when new information such as earnings or news comes in, you can see how other investors adjust their fair values for Terex. For example, one Narrative might assume very optimistic revenue growth and a higher fair value, while another might build in slower growth, lower margins and a more conservative fair value, giving you a clear range of views to compare with your own.
Do you think there's more to the story for Terex? Head over to our Community to see what others are saying!

This article by Simply Wall St is general in nature. We provide commentary based on historical data and analyst forecasts only using an unbiased methodology and our articles are not intended to be financial advice. It does not constitute a recommendation to buy or sell any stock, and does not take account of your objectives, or your financial situation. We aim to bring you long-term focused analysis driven by fundamental data. Note that our analysis may not factor in the latest price-sensitive company announcements or qualitative material. Simply Wall St has no position in any stocks mentioned.