Is TJX Companies (TJX) Still Attractive After Recent Share Price Pullback And Strong Multi‑Year Rally
TJX Companies Inc TJX | 161.29 | -0.46% |
- If you are wondering whether TJX Companies at about US$150 a share still offers value, you are not alone, especially after such a strong long term return profile.
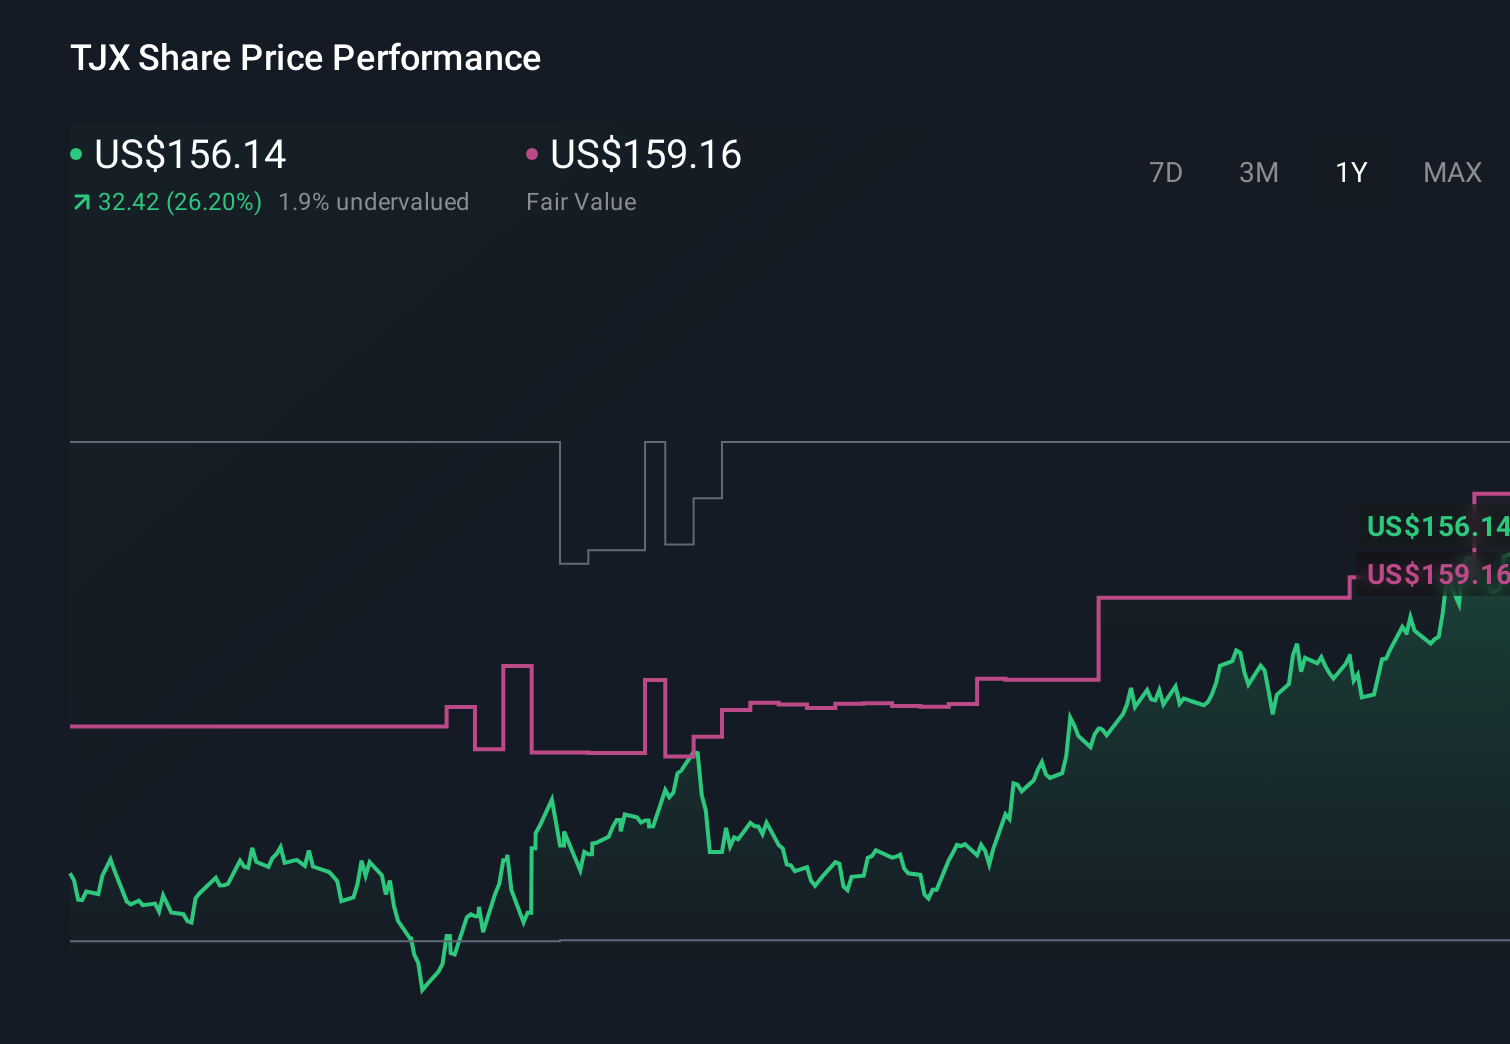
- The stock is down about 4.6% over the last week and 4.5% over the last month, while it is still up 21.6% over 1 year, 91.9% over 3 years and 152.3% over 5 years.
- Recent headlines around TJX have focused on its position as a large off price retailer and its role as a major player in U.S. retail. This has kept investor attention on how resilient its business model can be through different conditions. This backdrop helps frame whether the latest share price pullback is a simple pause or a sign that expectations and risks are being reassessed.
- Right now TJX Companies has a valuation score of 0 out of 6, which means none of our six valuation checks currently flag the stock as undervalued. Next we will run through the usual valuation tools and then finish with a more complete way to think about what the market is really pricing in.
TJX Companies scores just 0/6 on our valuation checks. See what other red flags we found in the full valuation breakdown.
Approach 1: TJX Companies Discounted Cash Flow (DCF) Analysis
A Discounted Cash Flow, or DCF, model takes estimates of the cash a business could generate in the future and discounts those projections back to today to arrive at an estimate of what the company might be worth right now.
For TJX Companies, the model used is a 2 Stage Free Cash Flow to Equity approach, based on last twelve month free cash flow of about $4.49b. Analyst estimates and extrapolated figures suggest free cash flow projections ranging from about $4.54b in 2026 to $6.48b in 2030, all expressed in US$. Simply Wall St extends analyst inputs beyond the usual 5 year window by extrapolating the later years.
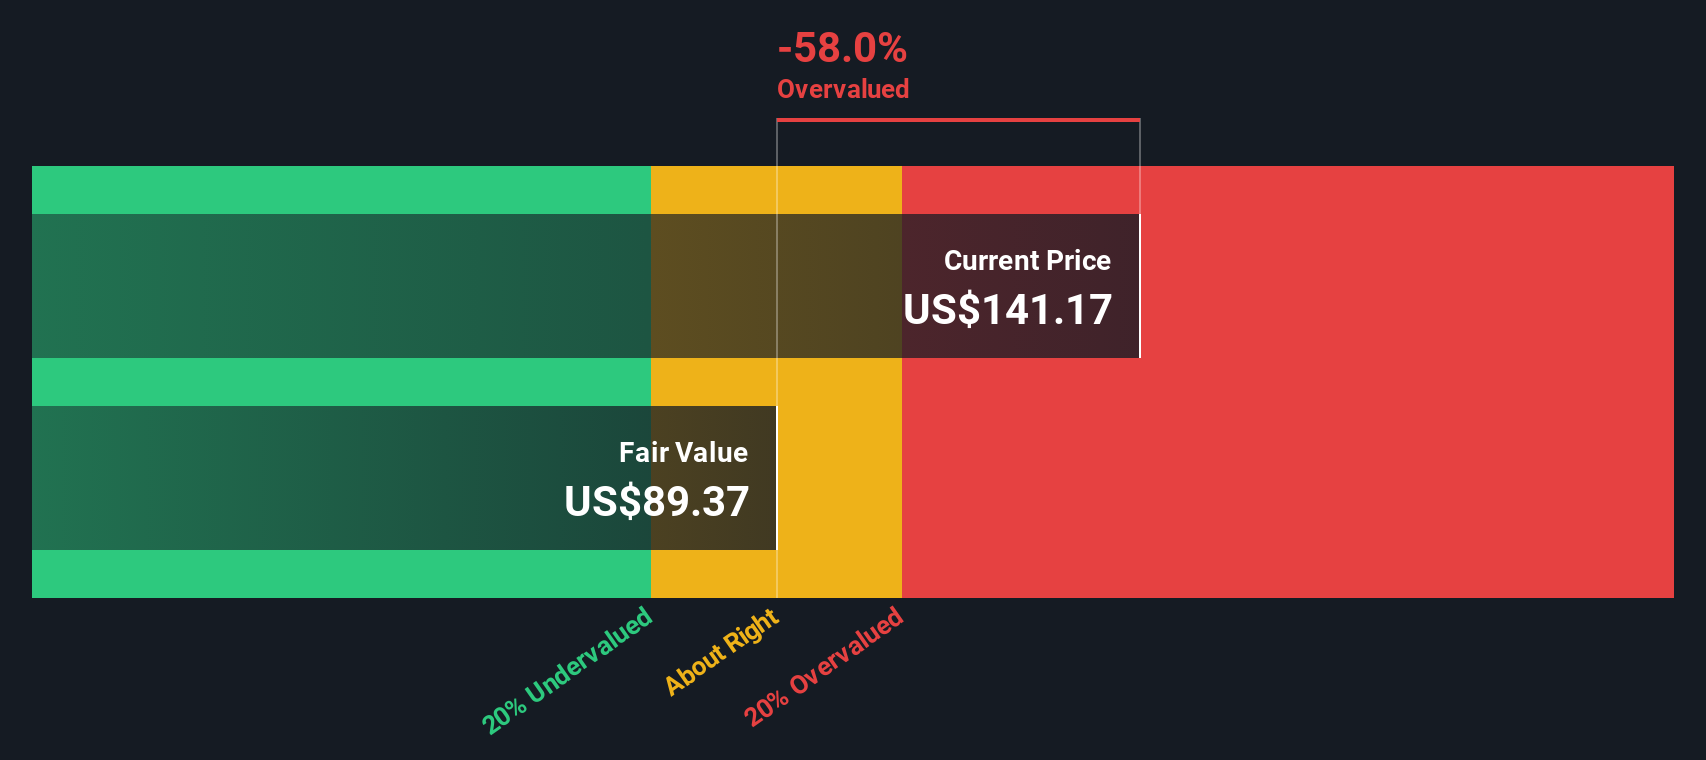
After discounting those projected cash flows back to today, the DCF model arrives at an estimated intrinsic value of about $94.93 per share. Compared with a share price around $150, the implied intrinsic discount suggests the stock is about 58.1% overvalued on this cash flow view.
Result: OVERVALUED
Our Discounted Cash Flow (DCF) analysis suggests TJX Companies may be overvalued by 58.1%. Discover 886 undervalued stocks or create your own screener to find better value opportunities.
Approach 2: TJX Companies Price vs Earnings
For a profitable business like TJX Companies, the P/E ratio is a useful yardstick because it tells you how much investors are paying today for each dollar of current earnings. It is a quick way to see how the market is weighing the company’s earnings power.
What counts as a reasonable P/E depends a lot on what investors expect for future growth and how risky they think those earnings are. Higher expected growth or lower perceived risk can support a higher multiple, while slower growth or higher risk usually leads to a lower one.
TJX Companies currently trades on a P/E of about 32.56x. That stands above the Specialty Retail industry average of about 19.89x and a peer average of around 21.50x. Simply Wall St’s Fair Ratio for TJX Companies is 22.07x. This is a proprietary estimate of what a P/E might look like for the company after considering its earnings growth profile, industry, profit margins, size and risk factors.
Because the Fair Ratio builds these company specific inputs into one number, it can be more informative than a simple comparison with peers or the broad industry. With the current P/E around 32.56x versus a Fair Ratio of 22.07x, the shares look expensive on this metric.
Result: OVERVALUED
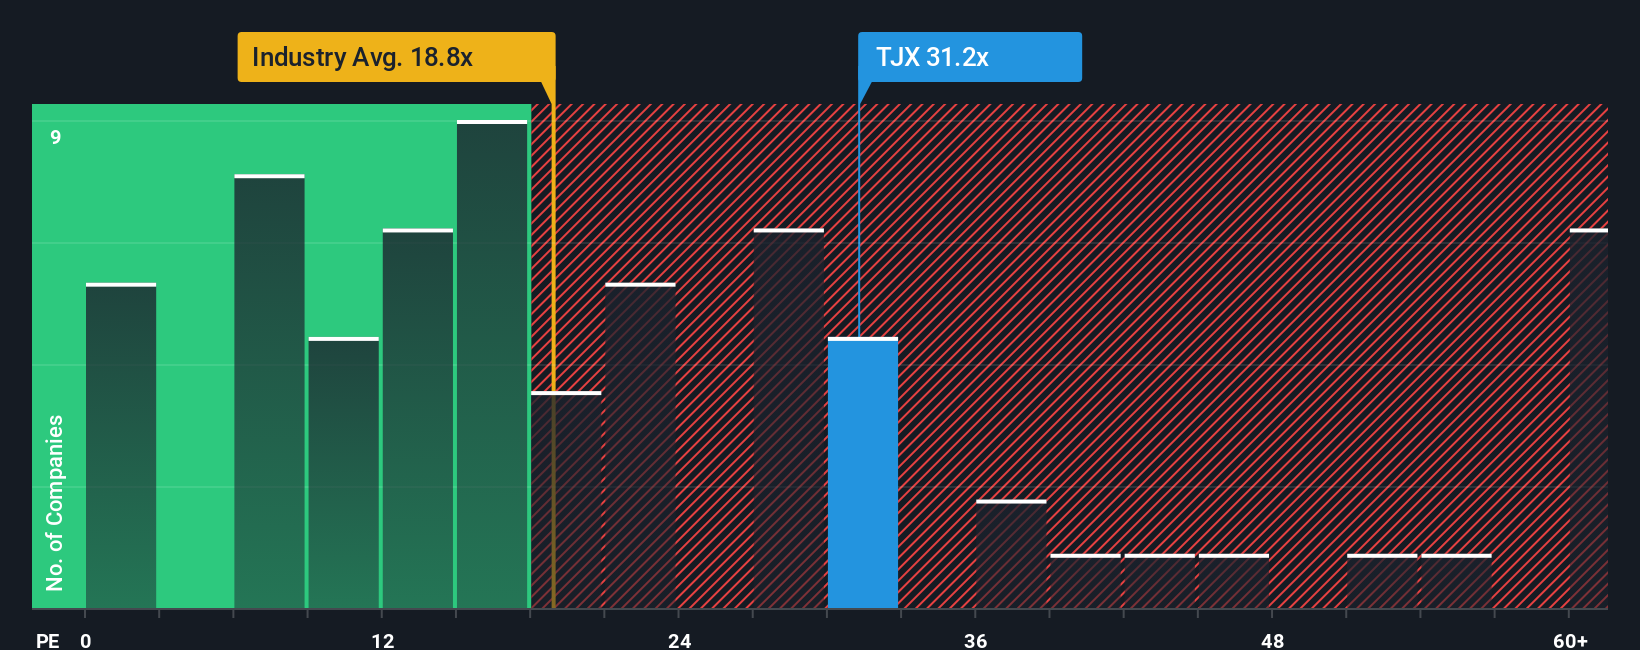
P/E ratios tell one story, but what if the real opportunity lies elsewhere? Discover 1424 companies where insiders are betting big on explosive growth.
Upgrade Your Decision Making: Choose your TJX Companies Narrative
Earlier we mentioned that there is an even better way to understand valuation, so let us introduce you to Narratives, which are simply your story about TJX Companies, linked directly to a financial forecast and then to a fair value that you can compare against today’s share price.
On Simply Wall St’s Community page, millions of investors use Narratives to set their own assumptions for future revenue, earnings and margins, then see what those inputs imply for fair value and whether the current price looks high, low or roughly in line with their view.
Because Narratives sit on top of live data, they update automatically when new information such as earnings releases or news is reflected in the underlying numbers. This means your story and fair value estimate stay aligned with the latest inputs without extra work from you.
For TJX Companies, one investor might build a Narrative that points to a fair value well below US$150, while another might see a fair value above the current price. This shows how different views on future growth, risk and profitability can translate into very different conclusions about whether the stock looks attractive or not today.
Do you think there's more to the story for TJX Companies? Head over to our Community to see what others are saying!
This article by Simply Wall St is general in nature. We provide commentary based on historical data and analyst forecasts only using an unbiased methodology and our articles are not intended to be financial advice. It does not constitute a recommendation to buy or sell any stock, and does not take account of your objectives, or your financial situation. We aim to bring you long-term focused analysis driven by fundamental data. Note that our analysis may not factor in the latest price-sensitive company announcements or qualitative material. Simply Wall St has no position in any stocks mentioned.