Is TJX’s Stronger Comps and New Debt Shelf Quietly Shifting the Investment Case for TJX (TJX)?
TJX Companies Inc TJX | 0.00 |
- The TJX Companies recently reported a 6% increase in comparable sales, driven by higher customer transactions across major regions including the US, Canada, Europe, and Australia, while also filing a shelf registration for potential debt securities issuance and seeing over US$16,000,000 in insider share sales reported via SEC filings.
- This combination of broad-based demand for TJX’s off-price model and fresh financing flexibility gives investors more context on how the company is positioning itself amid shifting consumer behavior and inventory trends.
- With this backdrop of stronger comparable sales and global customer traffic, we will now examine how these developments affect TJX’s investment narrative.
AI is about to change healthcare. These 39 stocks are working on everything from early diagnostics to drug discovery. The best part - they are all under $10b in market cap - there's still time to get in early.
TJX Companies Investment Narrative Recap
To be a TJX shareholder, you need to believe its off price, treasure hunt model can keep drawing broad, repeat traffic across geographies while managing sourcing and cost pressures. The latest 6% comparable sales growth reinforces that customer appeal, and the shelf registration modestly increases financial flexibility. Neither development appears to fundamentally change the near term balance between the key catalyst of healthy physical store traffic and the ongoing risk that e commerce and digital competitors keep gaining ground.
Among recent announcements, the Q1 FY2027 results stand out as most relevant here, with sales of US$14,323 million and net income of US$1,332 million, helped by higher customer transactions across regions. That context makes the new shelf registration and insider selling more interesting, as they arrive at a time when TJX is already showing solid traffic and earnings, yet still faces structural risks around sourcing quality inventory and managing rising labor and operating costs.
Yet even with stronger comps and global traffic, investors should be aware that rising labor and operating costs could still...
TJX Companies' narrative projects $74.0 billion revenue and $7.0 billion earnings by 2029. This requires 6.3% yearly revenue growth and about a $1.2 billion earnings increase from $5.8 billion today.
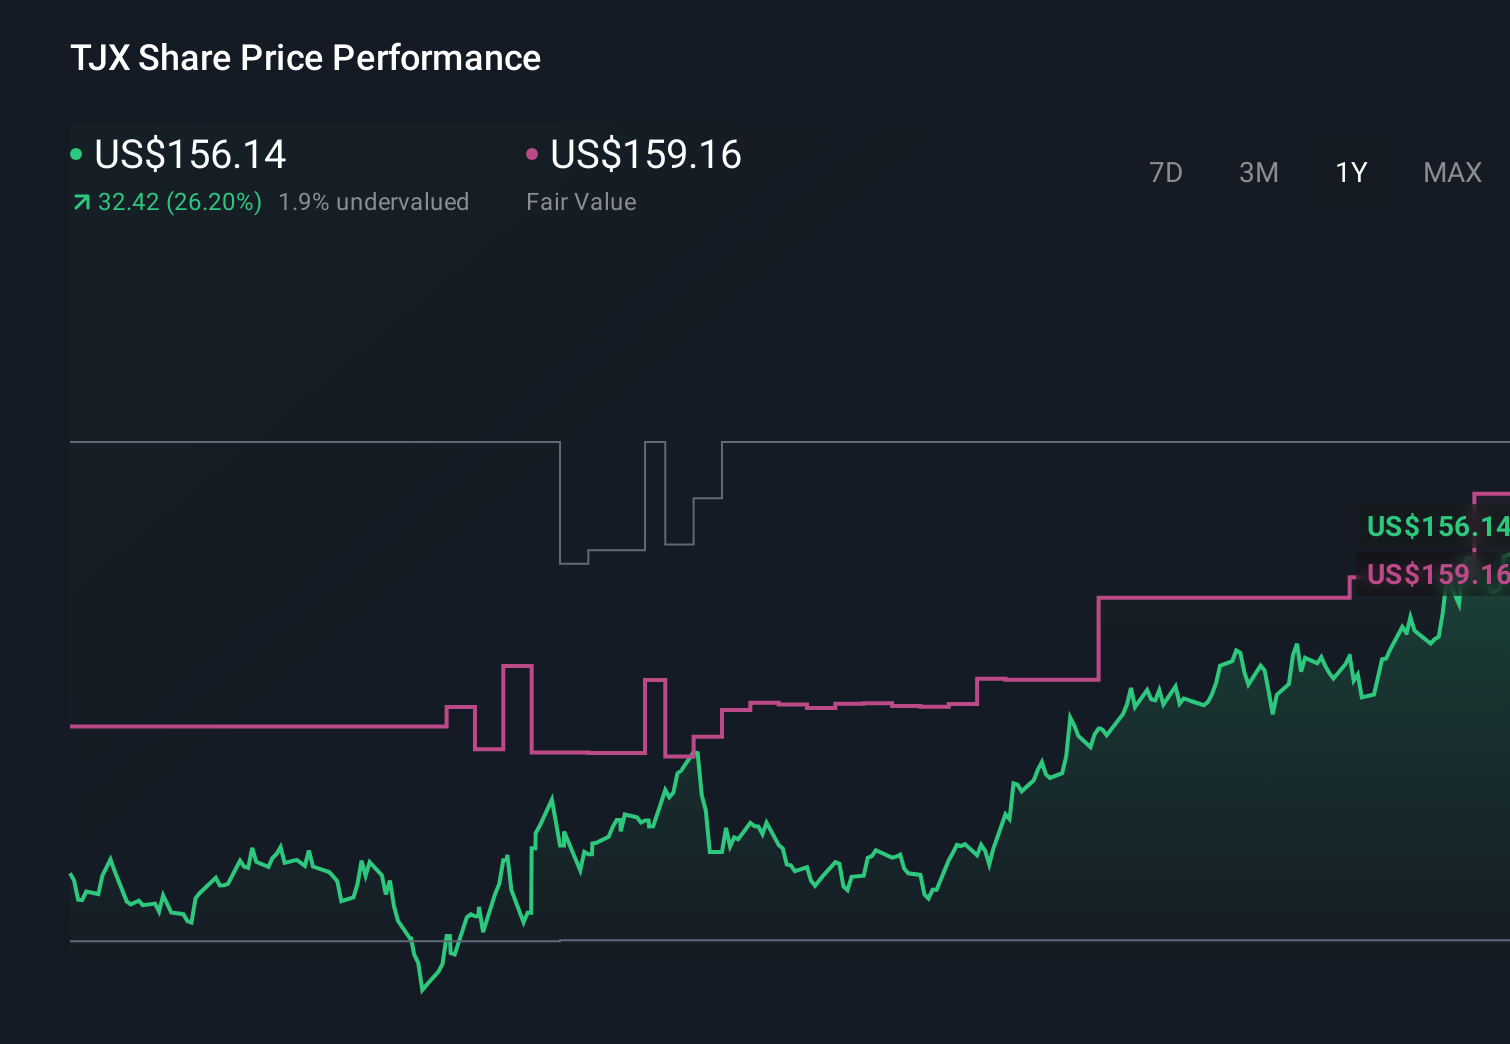
Uncover how TJX Companies' forecasts yield a $177.63 fair value, a 11% upside to its current price.
Exploring Other Perspectives
Some of the most optimistic analysts were already assuming TJX could grow revenue to about US$76.4 billion and earnings to roughly US$6.8 billion, but the latest sales strength and financing move may either support that view or expose how sensitive it is to wage and cost pressures, so it is worth comparing these expectations with your own.
Explore 7 other fair value estimates on TJX Companies - why the stock might be worth 38% less than the current price!
Form Your Own Verdict
Disagree with existing narratives? Extraordinary investment returns rarely come from following the herd, so go with your instincts.
- A great starting point for your TJX Companies research is our analysis highlighting 2 key rewards and 1 important warning sign that could impact your investment decision.
- Our free TJX Companies research report provides a comprehensive fundamental analysis summarized in a single visual - the Snowflake - making it easy to evaluate TJX Companies' overall financial health at a glance.
Curious About Other Options?
Our daily scans reveal stocks with breakout potential. Don't miss this chance:
- We've uncovered the 10 dividend fortresses yielding 5%+ that don't just survive market storms, but thrive in them.
- The future of work is here. Discover the 33 top robotics and automation stocks leading the charge in AI-driven automation and industrial transformation.
- Find 47 companies with promising cash flow potential yet trading below their fair value.
This article by Simply Wall St is general in nature. We provide commentary based on historical data and analyst forecasts only using an unbiased methodology and our articles are not intended to be financial advice. It does not constitute a recommendation to buy or sell any stock, and does not take account of your objectives, or your financial situation. We aim to bring you long-term focused analysis driven by fundamental data. Note that our analysis may not factor in the latest price-sensitive company announcements or qualitative material. Simply Wall St has no position in any stocks mentioned.