Is VICI Properties (VICI) Offering Value After Trailing Specialized REIT Peers This Year?
VICI Properties Inc VICI | 0.00 |
- Wondering if VICI Properties at US$28.22 is a bargain or a trap? This article walks through what the current price might be implying about the stock's value.
- The share price is roughly flat year to date with a 0.2% gain, but has declined 1% over the last week and 1.3% over the past month, while the return over the last year is down 5.5%.
- Recent headlines around VICI Properties have focused on how the stock has trailed the broader Specialized REITs peer group over the last year, reinforcing questions about whether investors are pricing in higher risk or slower prospects. At the same time, articles have highlighted the company's role as a large-scale experiential real estate owner, which can shape how investors think about the stability of its cash flows.
- Against this backdrop, VICI Properties currently scores a 6 out of 6 valuation check score. Next up is a closer look at the different valuation methods behind that result and a later section on an even richer way to think about what "fair value" might mean for this stock.
Approach 1: VICI Properties Discounted Cash Flow (DCF) Analysis
A Discounted Cash Flow model projects a company’s future cash flows, then discounts them back to today’s dollars to estimate what the entire business could be worth right now. For VICI Properties, the model uses adjusted funds from operations as a proxy for free cash flow to equity.
The latest twelve months free cash flow stands at about $2.53b. Analysts provide explicit forecasts out to 2028, where free cash flow is projected at $2.92b, and Simply Wall St extrapolates this further using its 2 Stage Free Cash Flow to Equity framework. Over the 10 year span from 2026 to 2035, these projected cash flows are discounted back to today using the model’s required return assumptions.
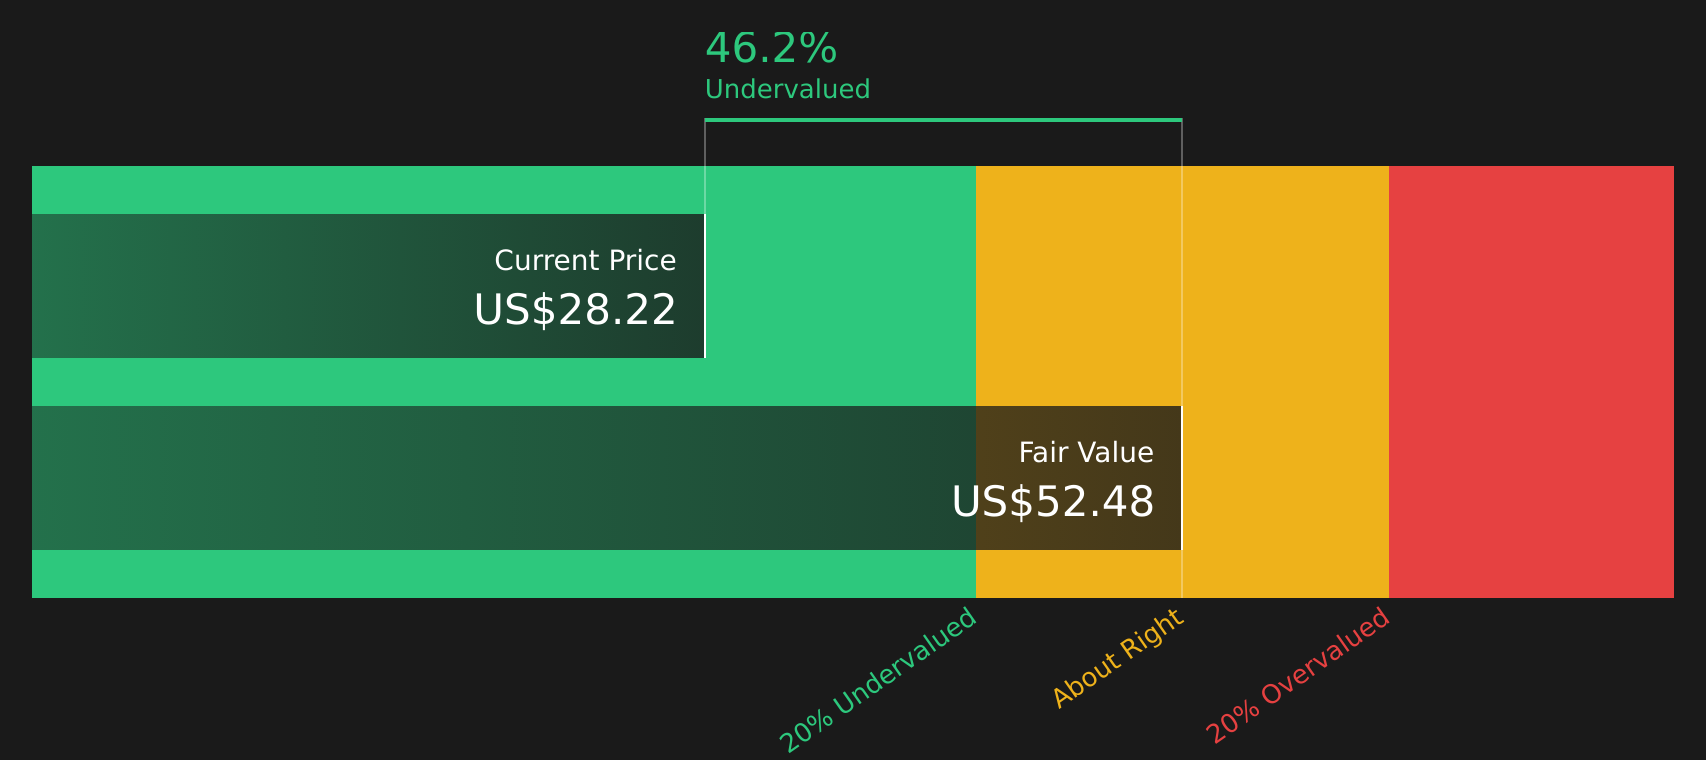
Bringing all of those cash flows together gives an estimated intrinsic value of $52.48 per share for VICI Properties. Compared with the recent share price of $28.22, the DCF suggests the stock is trading at a 46.2% discount, which indicates material undervaluation based on this cash flow view alone.
Result: UNDERVALUED
Our Discounted Cash Flow (DCF) analysis suggests VICI Properties is undervalued by 46.2%. Track this in your watchlist or portfolio, or discover 46 more high quality undervalued stocks.
Approach 2: VICI Properties Price vs Earnings
For a profitable company, the P/E ratio is a straightforward way to think about what you are paying for each dollar of earnings, which makes it a useful cross check against the cash flow model you saw earlier. Higher expected growth and lower perceived risk usually support a higher P/E, while slower expected growth or higher risk tend to justify a lower multiple.
VICI Properties currently trades at about 9.93x earnings. That sits below the Specialized REITs industry average of about 15.95x and well below the broader peer group average of about 53.65x. To refine this comparison, Simply Wall St uses a proprietary “Fair Ratio” of 32.11x, which estimates the P/E that might be reasonable for VICI Properties given factors like its earnings profile, industry, profit margins, market value and risk characteristics.
This Fair Ratio can be more informative than a simple industry or peer comparison because it is tailored to the company’s specific traits rather than assuming all REITs should trade on the same multiple. Set against the current P/E of 9.93x, the Fair Ratio of 32.11x suggests the stock is trading below that reference point.
Result: UNDERVALUED

P/E ratios tell one story, but what if the real opportunity lies elsewhere? Start investing in legacies, not executives. Discover our 20 top founder-led companies.
Upgrade Your Decision Making: Choose your VICI Properties Narrative
Earlier we mentioned that there is an even better way to understand valuation. Narratives let you attach a clear story about VICI Properties to the numbers by linking your view on its future revenue, earnings and margins to a financial forecast and a fair value. You can then compare that fair value to the current price, all within an easy tool on Simply Wall St’s Community page that updates as new news or earnings arrive. One investor might build a Narrative that lines up with the higher fair value around the bullish US$39 target, while another might prefer a more cautious story near the US$29 end of the range. Seeing those side by side can help you decide how your own view of VICI Properties stacks up before you choose whether the stock looks attractive or not at today’s price.
Do you think there's more to the story for VICI Properties? Head over to our Community to see what others are saying!

This article by Simply Wall St is general in nature. We provide commentary based on historical data and analyst forecasts only using an unbiased methodology and our articles are not intended to be financial advice. It does not constitute a recommendation to buy or sell any stock, and does not take account of your objectives, or your financial situation. We aim to bring you long-term focused analysis driven by fundamental data. Note that our analysis may not factor in the latest price-sensitive company announcements or qualitative material. Simply Wall St has no position in any stocks mentioned.