

Is W. R. Berkley’s (WRB) EPS Lift and Ongoing Buybacks Redefining Its Capital Allocation Story?
W. R. Berkley Corporation WRB | 0.00 |
- W. R. Berkley Corporation recently reported past second-quarter 2026 results, with revenue of US$3,716.12 million and net income of US$452.26 million, alongside higher basic and diluted earnings per share from continuing operations compared with a year earlier.
- Over the same period, the company also continued a long-running buyback program, repurchasing 1,684,736 shares for US$111.50 million, bringing total repurchases since 2006 to 167,639,222 shares and meaningfully shrinking its share count over time.
- Now, we’ll examine how W. R. Berkley’s higher quarterly earnings and continued share repurchases may influence the company’s investment narrative.
Outshine the giants: these 17 early-stage AI stocks could fund your retirement.
W. R. Berkley Investment Narrative Recap
To own W. R. Berkley, you need to be comfortable with a specialty-focused commercial insurer that leans on underwriting discipline, investment income, and active capital returns. The latest quarter’s higher earnings and ongoing buybacks support that story in the near term, but the key short term catalyst remains underwriting margins in competitive property and reinsurance lines, while rising catastrophe exposure still looks like the biggest risk. This earnings beat does not materially change that risk balance.
The most relevant recent development alongside earnings is the continued buyback program, with 1,684,736 shares repurchased in the second quarter of 2026, taking total buybacks since 2006 to 167,639,222 shares. This shrinking share count can amplify per share results when earnings hold up, which ties directly into the current catalyst around margin resilience and capital efficiency at a time when competition and pricing discipline are under pressure.
Yet investors should also recognize how rising catastrophe exposure and competitive pressures could affect underwriting volatility and are risks they need to be aware of...
W. R. Berkley's narrative projects $14.3 billion revenue and $2.0 billion earnings by 2028. This implies essentially flat (0.0% annually) revenue growth and an earnings increase of about $0.2 billion from $1.8 billion today.
Uncover how W. R. Berkley's forecasts yield a $68.33 fair value, a 9% downside to its current price.
Exploring Other Perspectives
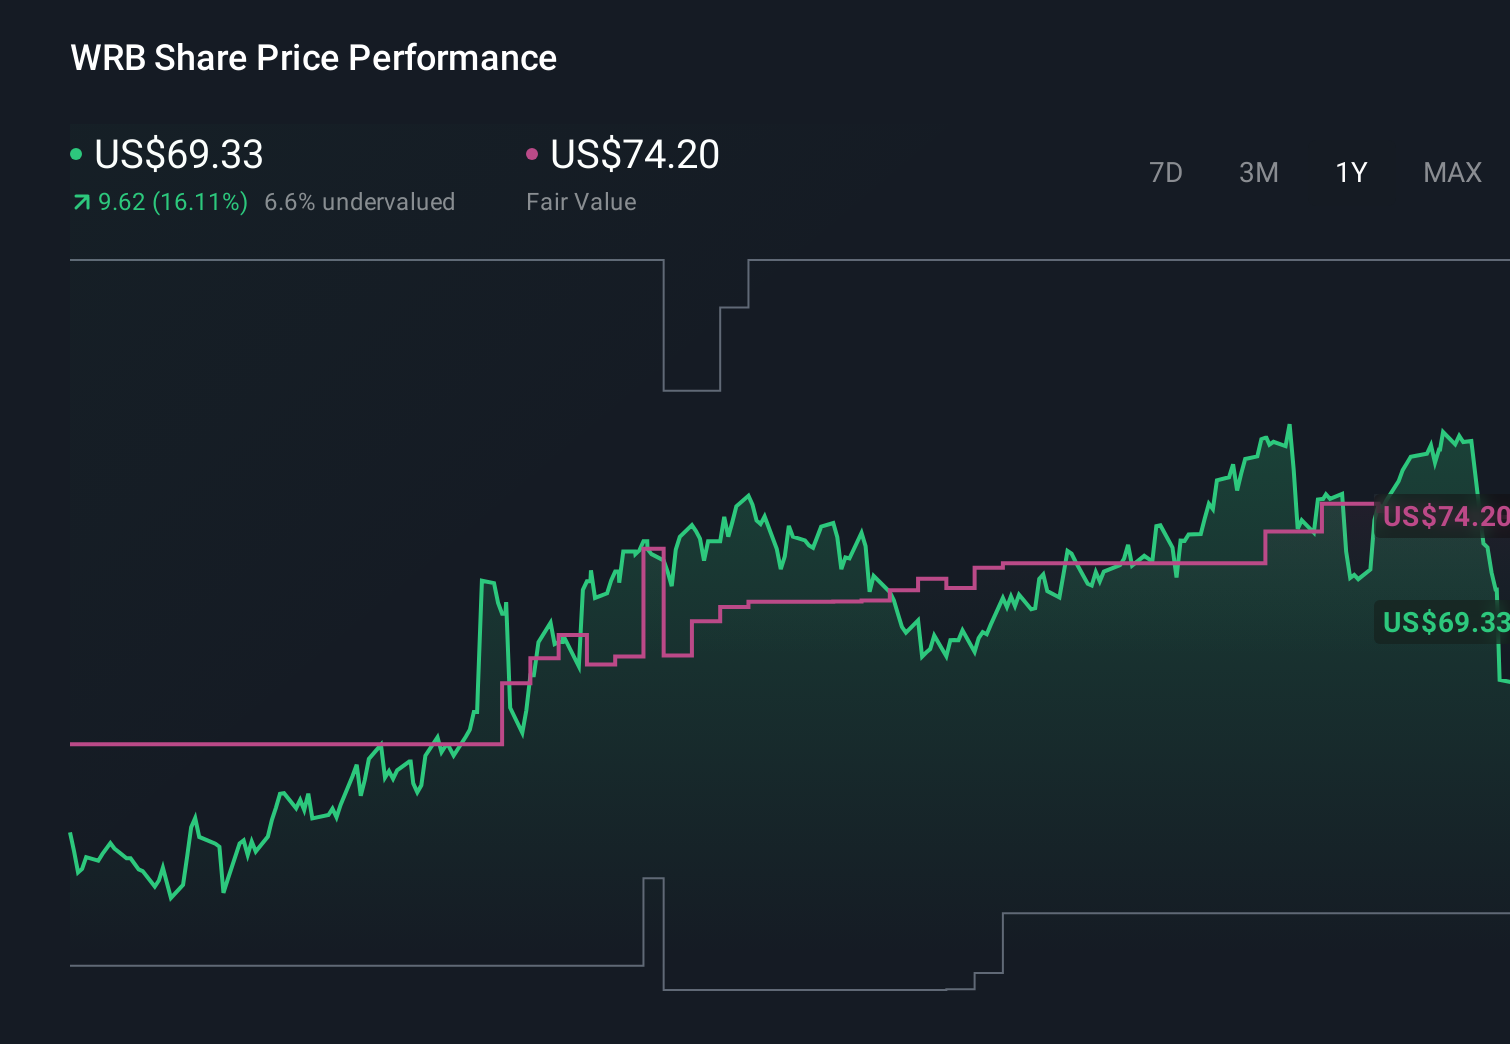
Some of the lowest ranked analysts were expecting revenue to shrink about 2.3 percent a year and earnings to reach roughly US$2.0 billion by 2029, so their more pessimistic view on catastrophe and competition risks could shift again after a quarter like this, reminding you that reasonable people can look at the same numbers and reach very different conclusions.
Explore 2 other fair value estimates on W. R. Berkley - why the stock might be worth 9% less than the current price!
Form Your Own Verdict
Don't just follow the ticker - dig into the data and build a conviction that's truly your own.
- A great starting point for your W. R. Berkley research is our analysis highlighting 2 key rewards and 2 important warning signs that could impact your investment decision.
- Our free W. R. Berkley research report provides a comprehensive fundamental analysis summarized in a single visual - the Snowflake - making it easy to evaluate W. R. Berkley's overall financial health at a glance.
Seeking Other Investments?
Our top stock finds are flying under the radar-for now. Get in early:
- We've uncovered the 9 dividend fortresses yielding 5%+ that don't just survive market storms, but thrive in them.
- Capitalize on the AI infrastructure supercycle with our selection of the 55 best 'picks and shovels' of the AI gold rush converting record-breaking demand into massive cash flow.
- AI is about to change healthcare. These 40 stocks are working on everything from early diagnostics to drug discovery. The best part - they are all under $10b in market cap - there's still time to get in early.
This article by Simply Wall St is general in nature. We provide commentary based on historical data and analyst forecasts only using an unbiased methodology and our articles are not intended to be financial advice. It does not constitute a recommendation to buy or sell any stock, and does not take account of your objectives, or your financial situation. We aim to bring you long-term focused analysis driven by fundamental data. Note that our analysis may not factor in the latest price-sensitive company announcements or qualitative material. Simply Wall St has no position in any stocks mentioned.