

Jefferies Financial Group (JEF) At 16.1x P E Following New Note Offeringsҟ
Jefferies Financial Group Inc. JEF | 0.00 |
Jefferies Financial Group (JEF) has come into focus after announcing several fixed income offerings, including new callable senior unsecured notes with fixed coupons and staggered maturities, a funding move that sits alongside recent equity market interest in the stock.
Jefferies Financial Group’s recent fixed income activity comes after a mixed stretch for the stock, with the share price down 10% over 30 days but up 16% over 90 days. Meanwhile, 1 year and 5 year total shareholder returns of 2% and 106% suggest longer term holders have seen a different experience from recent short term share price pressure.
If these funding moves have you thinking about where capital markets strength could show up next, it might be worth widening the lens and checking out 18 top founder-led companies
For Jefferies Financial Group, the tension now is clear: are the recent bond issues and choppy share price mainly a readout on the underlying business, or a swing in sentiment around capital markets stocks more broadly as investors rethink valuation?
Preferred P/E of 16.1x: Is it justified?
For Jefferies Financial Group, the current share price of $55.80 lines up with a P/E of 16.1x, which screens as relatively undemanding compared with both its own fair ratio and peers.
The P/E multiple tells you what investors are paying for each dollar of earnings, which matters a lot for a capital markets firm where profitability can swing with deal activity and trading conditions. A 16.1x P/E that sits below the US market level of 19.2x suggests the stock is not priced at a premium, even with earnings that have grown 38.6% over the past year and net profit margins currently at 9.6% versus 8.4% a year earlier.
Against direct peers, Jefferies Financial Group trades on a P/E that is slightly below the 16.4x peer average and well below the 40x average for the broader US Capital Markets industry. This gap implies the market is pricing in more modest growth and returns than many sector comparables. The estimated “fair” P/E of 17.1x, based on the SWS fair ratio work, sits a little higher than the current 16.1x level, pointing to a valuation that could move closer to that benchmark if earnings trends and returns hold up.
Result: Price-to-earnings of 16.1x (ABOUT RIGHT)
However, Jefferies Financial Group’s story could be tested if capital markets activity softens or if recent fixed income issuance increases funding costs and reduces returns.
Another View: What The SWS DCF Model Says About Jefferies Financial Group
The P/E work suggests Jefferies Financial Group is on reasonable terms, but the SWS DCF model tells a different story. With the stock at $55.80 versus an estimated future cash flow value of $50.13, the shares screen as trading above that DCF output. This raises a simple question: which signal matters more for you, earnings or cash flows?
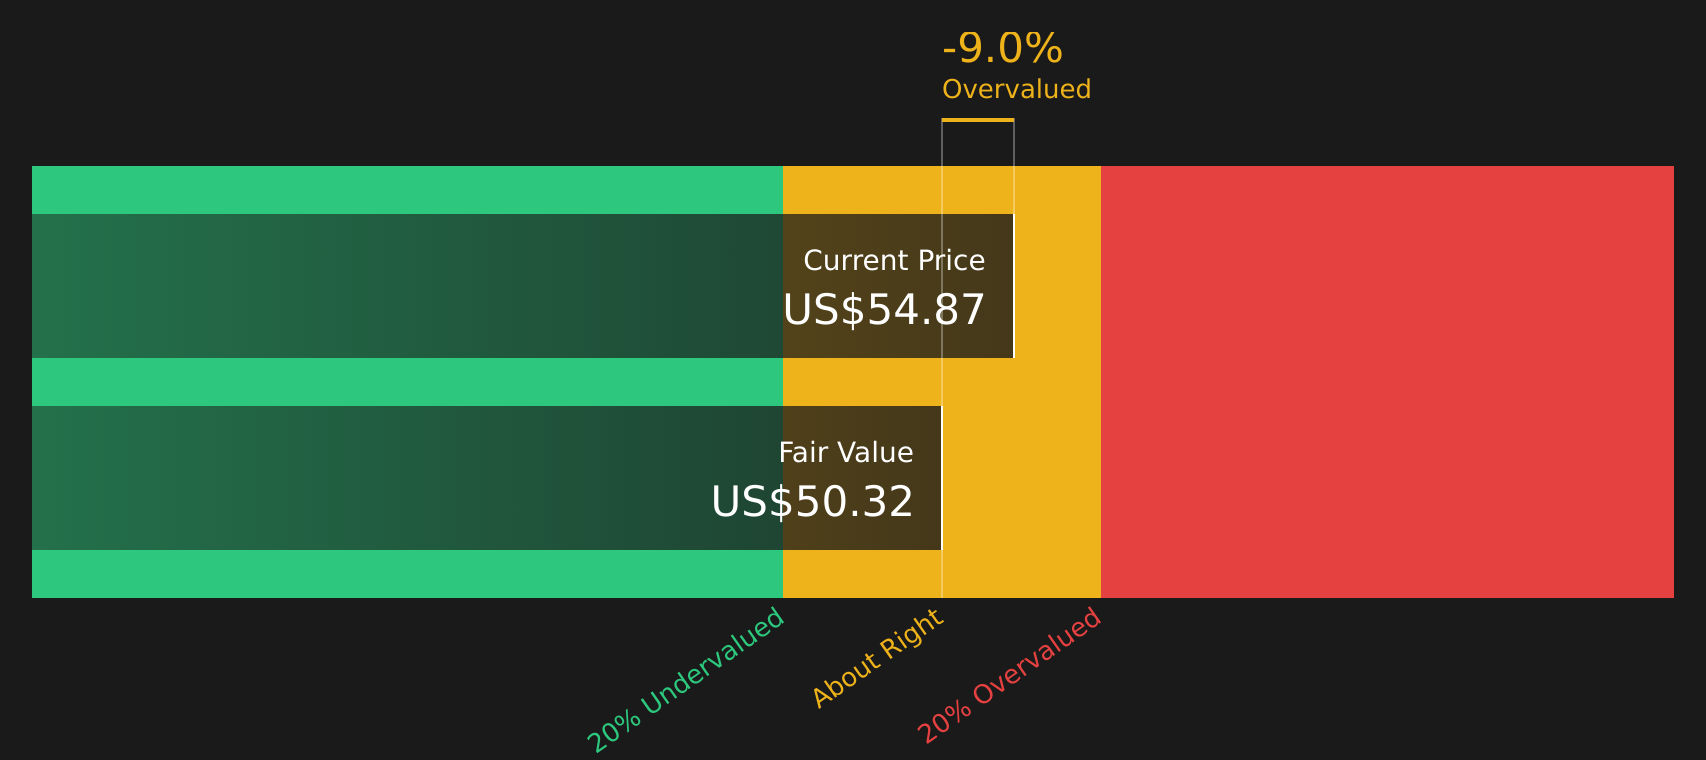
Simply Wall St performs a discounted cash flow (DCF) on every stock in the world every day (check out Jefferies Financial Group for example). We show the entire calculation in full. You can track the result in your watchlist or portfolio and be alerted when this changes, or use our stock screener to discover 49 high quality undervalued stocks. If you save a screener we even alert you when new companies match - so you never miss a potential opportunity.
Next Steps
Wondering how Jefferies Financial Group really stacks up after all this, and whether optimism around its rewards is warranted? Take a few minutes to review the numbers, compare different valuation angles, and pressure test the positives that investors are focused on by checking out 5 key rewards.
Looking for more investment ideas beyond Jefferies Financial Group?
If Jefferies Financial Group has you rethinking where to put fresh capital, do not stop here. Use focused stock lists to spot opportunities others might overlook.
- Hunt for value that still looks priced for caution by checking stocks in the 49 high quality undervalued stocks.
- Strengthen the income side of your portfolio by reviewing companies in the 8 dividend fortresses.
- Dial down potential shocks by scanning candidates in the 82 resilient stocks with low risk scores.
This article by Simply Wall St is general in nature. We provide commentary based on historical data and analyst forecasts only using an unbiased methodology and our articles are not intended to be financial advice. It does not constitute a recommendation to buy or sell any stock, and does not take account of your objectives, or your financial situation. We aim to bring you long-term focused analysis driven by fundamental data. Note that our analysis may not factor in the latest price-sensitive company announcements or qualitative material. Simply Wall St has no position in any stocks mentioned.