

Jefferies Financial Group (JEF) Could Be Fully Valued On Strong Earnings And Index Changes
Jefferies Financial Group Inc. JEF | 0.00 |
Jefferies Financial Group (JEF) has been in focus after being removed from several Russell growth indexes on June 27. The company also reported second quarter and year to date revenue and net income figures that attracted fresh investor attention.
At a share price of $54.84, Jefferies Financial Group has seen a 4.22% 1 day share price return and a 12.42% 7 day share price return. The 1 year total shareholder return of 1.52% contrasts with an 80.89% 3 year total shareholder return, suggesting longer term momentum has been stronger even as the year to date share price return of 13.58% is weaker. Recent index removals and strong earnings are likely influencing how investors view both growth prospects and risk.
If Jefferies Financial Group’s recent moves have you thinking about other financial opportunities, it could be a good moment to broaden your search with the 20 top founder-led companies
Bulls can point to Jefferies Financial Group’s recent earnings and capital returns, while bears highlight index removals and structured product risks. How do current cash flows, balance sheet choices, and earnings power stack up against the price you pay today?
Price-to-Earnings of 13.9x: Is it justified?
Jefferies Financial Group is trading on a P/E of 13.9x, which sits below both the broader US market and the US Capital Markets industry averages at the latest close of $54.84.
The P/E ratio compares the company’s share price to its earnings per share and is a common way investors gauge how much they are paying for current earnings. For a capital markets firm like Jefferies Financial Group, this can reflect how investors view the durability of fee income, trading results, and asset management earnings.
Here, several checks point to the market assigning a lower earnings multiple than both peers and an estimated fair level. The current P/E of 13.9x is below the US market average of 19.2x, below the peer average of 16.4x, and below an estimated fair P/E of 16.6x that the SWS fair ratio suggests the stock could trend toward if conditions align with that model.
Relative to the wider US Capital Markets industry, where the average P/E stands at 40.3x, Jefferies Financial Group’s current multiple is far lower. This indicates the stock is priced at a steeper discount to industry earnings than those comparative figures would suggest.
Result: Price-to-Earnings of 13.9x (UNDERVALUED)
However, investors still need to weigh Jefferies Financial Group’s index removals and exposure to complex capital markets activities, which can quickly shift sentiment and earnings visibility.
Another View: DCF Points to a Different Story
While Jefferies Financial Group looks inexpensive on a 13.9x P/E, the SWS DCF model points in the opposite direction, with the current $54.84 share price sitting above an estimated future cash flow value of $50.06. That suggests less of a margin of safety. Which signal matters more for you?
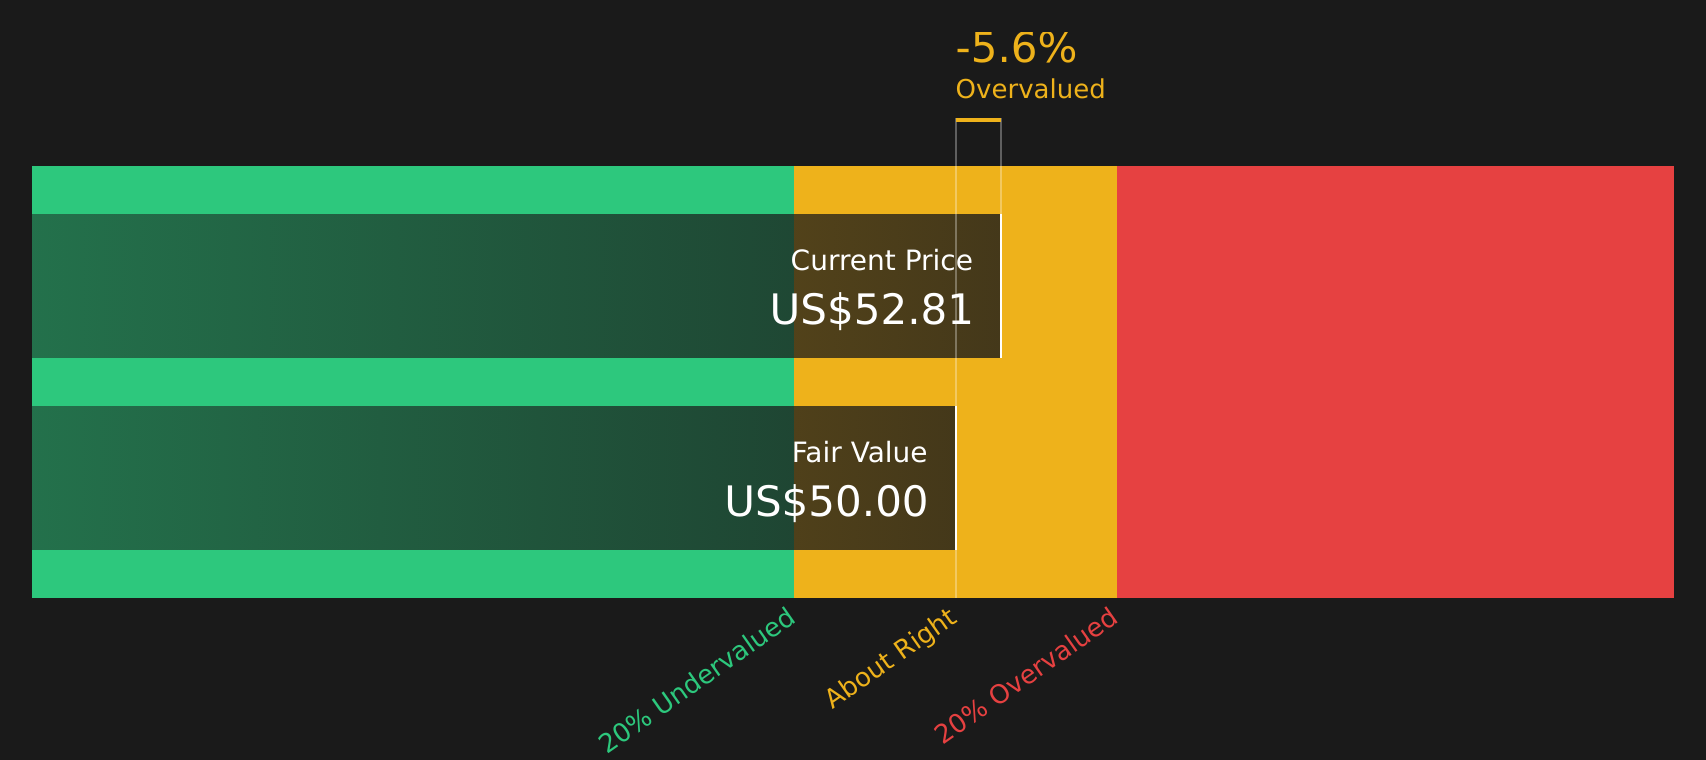
Simply Wall St performs a discounted cash flow (DCF) on every stock in the world every day (check out Jefferies Financial Group for example). We show the entire calculation in full. You can track the result in your watchlist or portfolio and be alerted when this changes, or use our stock screener to discover 41 high quality undervalued stocks. If you save a screener we even alert you when new companies match - so you never miss a potential opportunity.
Next Steps
Seeing both caution and optimism around Jefferies Financial Group, it makes sense to review the underlying data yourself and decide where you stand. A good place to start is the 4 key rewards and 1 important warning sign.
Looking for more investment ideas beyond Jefferies Financial Group?
If Jefferies Financial Group has sharpened your focus on valuation and quality, do not stop here. Broaden your opportunity set with these focused stock ideas.
- Target long term wealth building by using the 8 dividend fortresses that may help you identify income payers with staying power.
- Zero in on quality at a sensible price by scanning the 41 high quality undervalued stocks that filters for companies with strong fundamentals.
- Guard your capital by checking the 74 resilient stocks with low risk scores designed to spotlight stocks with more resilient risk profiles.
This article by Simply Wall St is general in nature. We provide commentary based on historical data and analyst forecasts only using an unbiased methodology and our articles are not intended to be financial advice. It does not constitute a recommendation to buy or sell any stock, and does not take account of your objectives, or your financial situation. We aim to bring you long-term focused analysis driven by fundamental data. Note that our analysis may not factor in the latest price-sensitive company announcements or qualitative material. Simply Wall St has no position in any stocks mentioned.