

Liquidia (LQDA) Turns Profitable On YUTREPIA Growth, Is The Upside Already Priced In?
LIQUIDIA TECHNOLOGIES INC LQDA | 0.00 |
Liquidia (LQDA) is back in focus after its second quarter 2026 report showed revenue of US$171.68 million and net income of US$74.72 million, reversing the loss reported a year earlier.
The latest earnings report appears to be a key driver behind Liquidia’s recent move, with the share price at US$75.33 and a year to date share price return of 139.9%. Despite some recent pullback over the past week and month, the 90 day share price return of 21.56%, alongside a one year total shareholder return of 175.43% and a very large five year total shareholder return, suggests momentum has been building around the company’s growth story and perceived risk profile.
If you are looking for more ideas in a market where strong gains can concentrate in a handful of stocks, it may be worth scanning for other companies with robust fundamentals through the 21 top founder-led companies
After a move like Liquidia’s, some investors will feel most of the upside has already played out, while others see this as the early stages of a bigger rerating. The valuation numbers are where those views really meet.
Most Popular Narrative: 4.1% Overvalued
Liquidia’s most followed narrative pegs fair value at $72.38 using a 7.11% discount rate, slightly below the last close at $75.33. This creates only a modest gap between price and modelled worth.
Analysts are assuming Liquidia's revenue will grow by 68.6% annually over the next 3 years.
Analysts assume that profit margins will increase from 7.7% today to 48.2% in 3 years time.
Want to see why this narrative supports a higher earnings base on a lower profit multiple? The story hinges on rapid scaling, rising margins and a compressed valuation anchor.
Result: Fair Value of $72.38 (OVERVALUED)
However, the Liquidia narrative still hinges on legal outcomes around the 327 patent and on demand eventually matching the expanded North Carolina manufacturing capacity.
Another View: Liquidia Through a Cash Flow Lens
While the most popular Liquidia narrative points to a small 4.1% premium to its US$72.38 fair value estimate, a separate take using the SWS DCF model paints a very different picture. On that framework, Liquidia at US$75.33 sits roughly 76% below an estimated future cash flow value of US$310.11. That gap highlights how sensitive fair value can be to long term cash flow and risk assumptions, so which set of numbers feels more realistic to you as an investor?
For a closer look at how those cash flow assumptions are built into the numbers, Look into how the SWS DCF model arrives at its fair value.
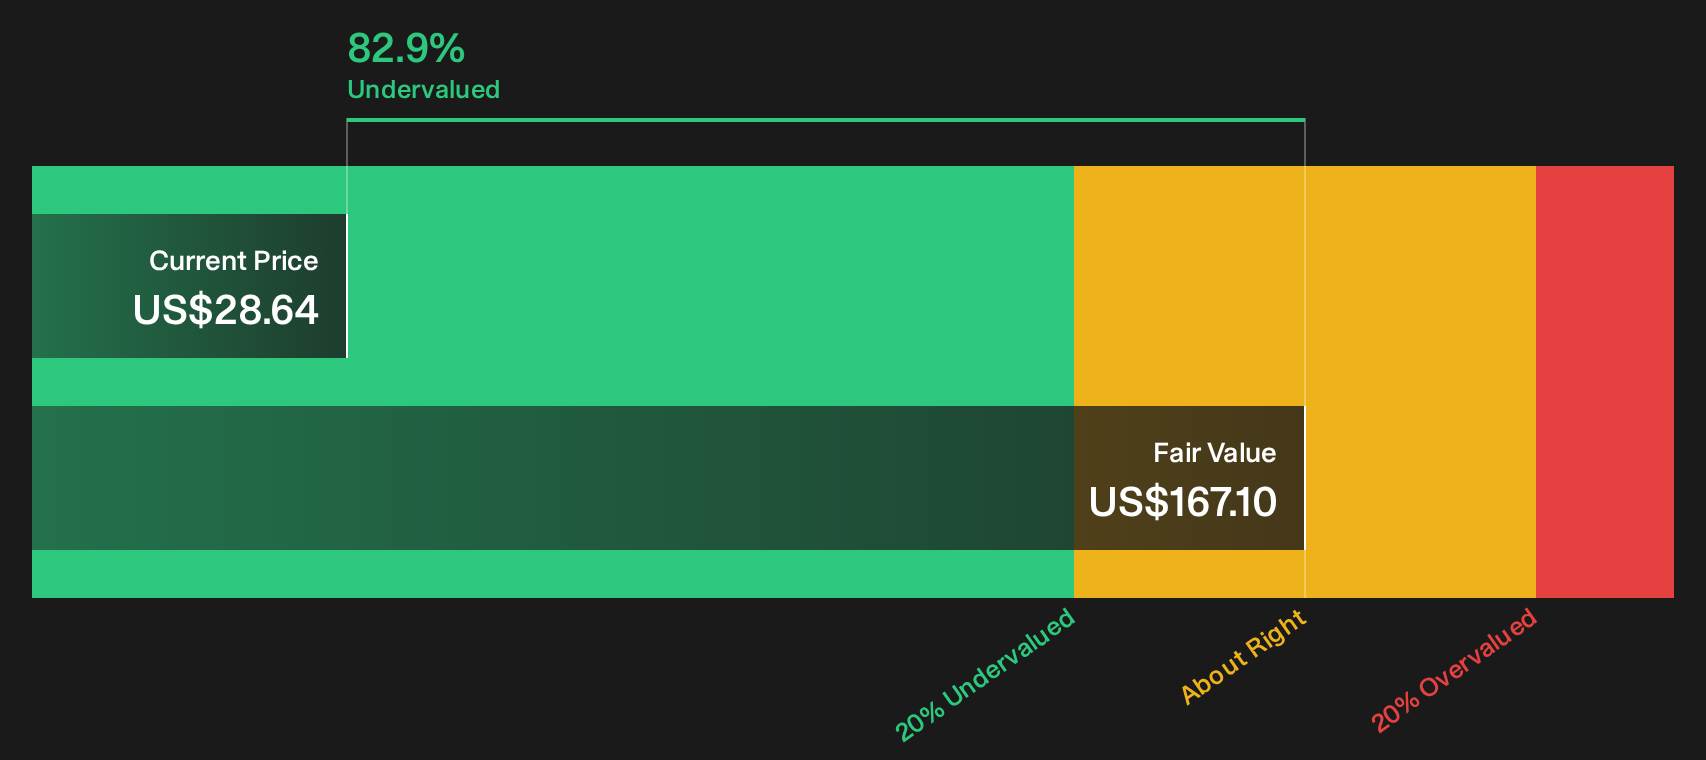
Simply Wall St performs a discounted cash flow (DCF) on every stock in the world every day (check out Liquidia for example). We show the entire calculation in full. You can track the result in your watchlist or portfolio and be alerted when this changes, or use our stock screener to discover 52 high quality undervalued stocks. If you save a screener we even alert you when new companies match - so you never miss a potential opportunity.
Next Steps
With sentiment split between opportunity and risk around Liquidia, you may want to move promptly and weigh the 4 key rewards and 1 important warning sign against your own research.
Looking beyond Liquidia for more investment ideas
If you stop with Liquidia, you could miss other stocks that fit your approach. Use targeted screeners now to sharpen your watchlist and spot fresh opportunities early.
- Target potential value opportunities before they are widely discussed by checking companies featured in the 52 high quality undervalued stocks
- Protect your downside by focusing on companies highlighted in the 78 resilient stocks with low risk scores
- Hunt for underfollowed opportunities with strong fundamentals by scanning the screener containing 20 high quality undiscovered gems
This article by Simply Wall St is general in nature. We provide commentary based on historical data and analyst forecasts only using an unbiased methodology and our articles are not intended to be financial advice. It does not constitute a recommendation to buy or sell any stock, and does not take account of your objectives, or your financial situation. We aim to bring you long-term focused analysis driven by fundamental data. Note that our analysis may not factor in the latest price-sensitive company announcements or qualitative material. Simply Wall St has no position in any stocks mentioned.