Monte Rosa Therapeutics (GLUE) Joins Russell Growth Indexes, Is The Upside Already Priced In?
Monte Rosa Therapeutics, Inc. GLUE | 0.00 |
Monte Rosa Therapeutics (GLUE) is in focus after a reshuffle of Russell indexes on 27 June 2026, with the stock added to several growth benchmarks and removed from multiple value benchmarks.
The index reshuffle comes on the back of strong recent momentum in Monte Rosa Therapeutics, with a 7.22% 1 day share price return, a 28.01% 7 day share price return and a 56.11% year to date share price return. This is alongside a very large 1 year total shareholder return of 429.93% that contrasts with a 270.54% 3 year total shareholder return and a 7.51% 5 year total shareholder return, suggesting sentiment has strengthened sharply in the short term.
If the Russell index moves have caught your attention, it may be a good moment to see what else is moving and check out 41 healthcare AI stocks
With Monte Rosa Therapeutics now firmly grouped with growth stocks and trading at $23.90 versus an average analyst price target of $32.33 and an estimated intrinsic value gap, is there still a potential opportunity for investors here, or is the market already reflecting expectations for future growth?
Preferred Price-to-Sales Multiple of 47x: Is It Justified?
Monte Rosa Therapeutics now sits in growth indexes, and the valuation reflects that status, with the stock trading on a P/S ratio of 47x despite still being unprofitable.
The P/S ratio compares the company’s market value with its revenue, so a higher multiple usually signals that investors are placing a strong emphasis on future sales potential rather than current earnings. Here, that higher multiple is being applied to revenue of $42.95m alongside a reported net loss of $130.01m and forecasts that earnings will decline on average by 10.5% per year over the next 3 years while remaining in loss-making territory.
Against that backdrop, Monte Rosa Therapeutics’ 47x P/S stands well above the peer average of 23.3x and well above the wider US Biotechs industry average of 11.8x. This suggests the stock is priced at a premium compared to many other companies in the sector. It also sits far above the estimated fair P/S ratio of 0.2x. That level implies a very different view of what investors might ultimately be willing to pay for each dollar of revenue if expectations or conditions change.
Result: Preferred multiple of Price-to-Sales of 47x (OVERVALUED)
However, Monte Rosa Therapeutics still faces risks, including ongoing net losses of $130.01m and the possibility that its high 47x P/S multiple compresses if sentiment cools.
Another View: What Does the SWS DCF Model Say About Monte Rosa Therapeutics?
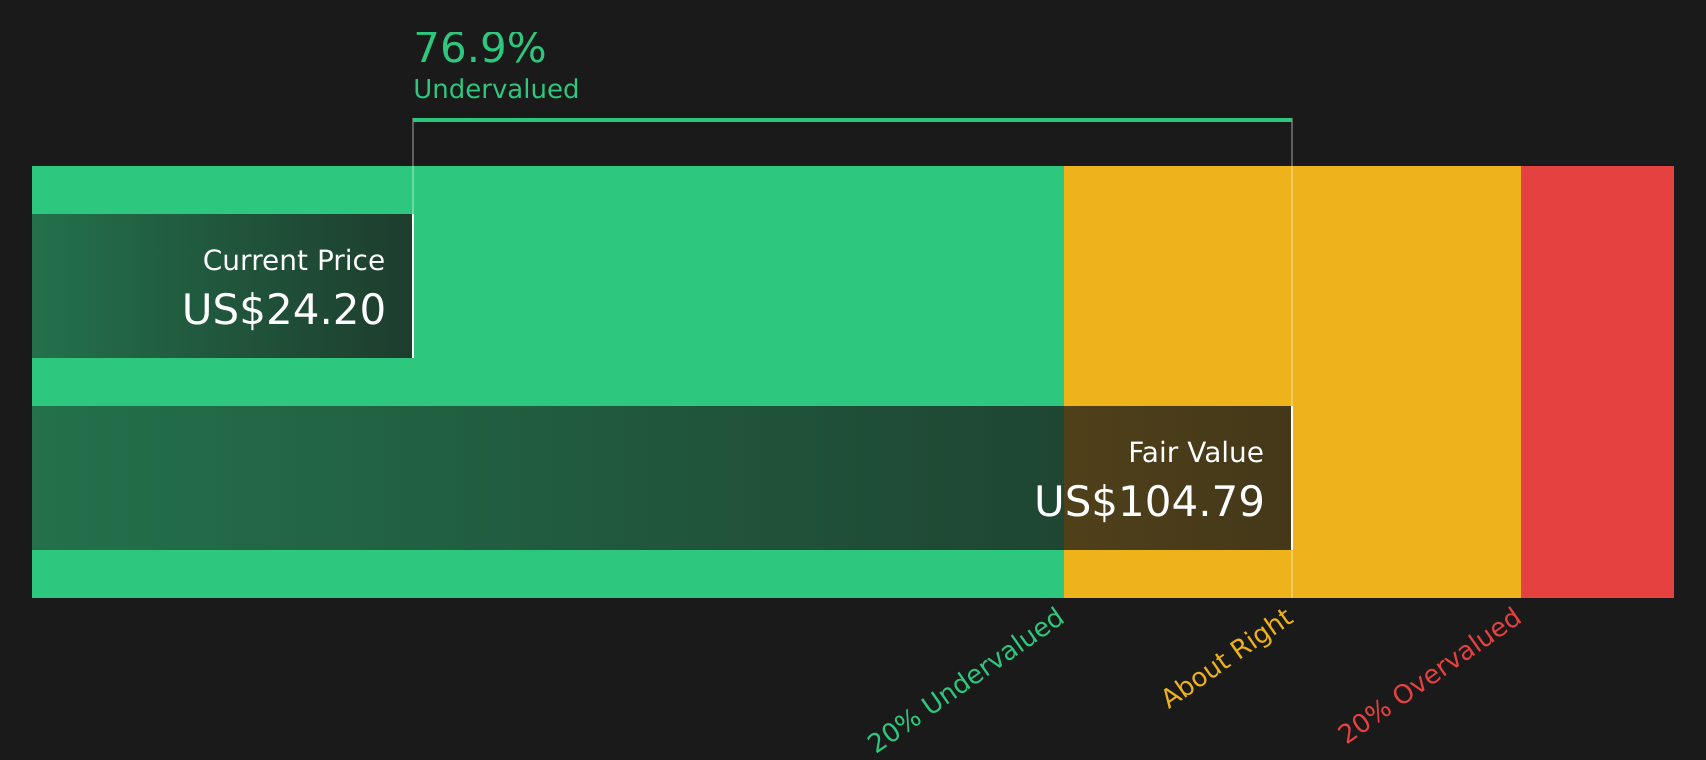
While Monte Rosa Therapeutics looks expensive on a 47x P/S ratio, the SWS DCF model paints a very different picture, with an estimated future cash flow value of $105.46 per share versus a current price of $23.90. That gap suggests potential undervaluation, so which signal should matter more to you?
Simply Wall St performs a discounted cash flow (DCF) on every stock in the world every day (check out Monte Rosa Therapeutics for example). We show the entire calculation in full. You can track the result in your watchlist or portfolio and be alerted when this changes, or use our stock screener to discover 42 high quality undervalued stocks. If you save a screener we even alert you when new companies match - so you never miss a potential opportunity.
Next Steps
Does the mix of enthusiasm and concern around Monte Rosa Therapeutics match your own view, or does it raise new questions you want answered? Act while the data is fresh, review both the potential upsides and the issues flagged, and weigh them against your own risk tolerance with the help of 3 key rewards and 4 important warning signs
Looking for more investment ideas beyond Monte Rosa Therapeutics?
If Monte Rosa Therapeutics has sharpened your interest in growth stories, do not stop here. Broaden your watchlist with other focused ideas that suit different styles.
- Target potential mispricing by scanning 42 high quality undervalued stocks that combine solid fundamentals with prices that may not fully reflect their current profile.
- Strengthen your income stream by reviewing 9 dividend fortresses that pair higher yields with an emphasis on stability.
- Spot future standouts early by combing through the screener containing 19 high quality undiscovered gems before they sit firmly on every investor’s radar.
This article by Simply Wall St is general in nature. We provide commentary based on historical data and analyst forecasts only using an unbiased methodology and our articles are not intended to be financial advice. It does not constitute a recommendation to buy or sell any stock, and does not take account of your objectives, or your financial situation. We aim to bring you long-term focused analysis driven by fundamental data. Note that our analysis may not factor in the latest price-sensitive company announcements or qualitative material. Simply Wall St has no position in any stocks mentioned.