MSC Industrial Direct (MSM) Stock After 47% Yearly Gain Is The Upside Now Limited
MSC Industrial Direct Co., Inc. Class A MSM | 0.00 |
- Wondering if MSC Industrial Direct at around US$115 per share still offers value, or if most of the easy gains are already behind it? This article focuses squarely on what the current price might imply about the stock.
- The stock has slipped about 1.2% over the past week, but is up 8.1% over the last month, 34.6% year to date and 46.6% over the past year. This naturally raises questions about how much risk and upside are now priced in.
- Recent coverage has centered on MSC Industrial Direct as a key distributor in the industrial supply chain, with attention on how its role with manufacturing and maintenance customers feeds into expectations for demand. This context, together with the share price performance, has kept the stock on many investors' watchlists and turned valuation into a focal point.
- On Simply Wall St's valuation checks, MSC Industrial Direct currently scores 0 out of 6 on measures of undervaluation. The next sections will compare different valuation approaches, and then finish with a framework that can help you judge whether those numbers fit your own view of the stock.
MSC Industrial Direct scores just 0/6 on our valuation checks. See what other red flags we found in the full valuation breakdown.
Approach 1: MSC Industrial Direct Discounted Cash Flow (DCF) Analysis
A Discounted Cash Flow model projects a company’s future cash flows and then discounts them back to today’s dollars to estimate what the business might be worth now. It is essentially asking what those future cash flows are worth in today’s terms.
For MSC Industrial Direct, the latest reported Free Cash Flow is about $206.0 million. Analysts and extrapolated estimates feed into a two stage Free Cash Flow to Equity model, which includes specific projections out to 2030. By 2035, the Simply Wall St model is using an extrapolated Free Cash Flow figure of about $273.3 million, with the ten year path between 2026 and 2035 based on a mix of analyst inputs and gradual growth assumptions.
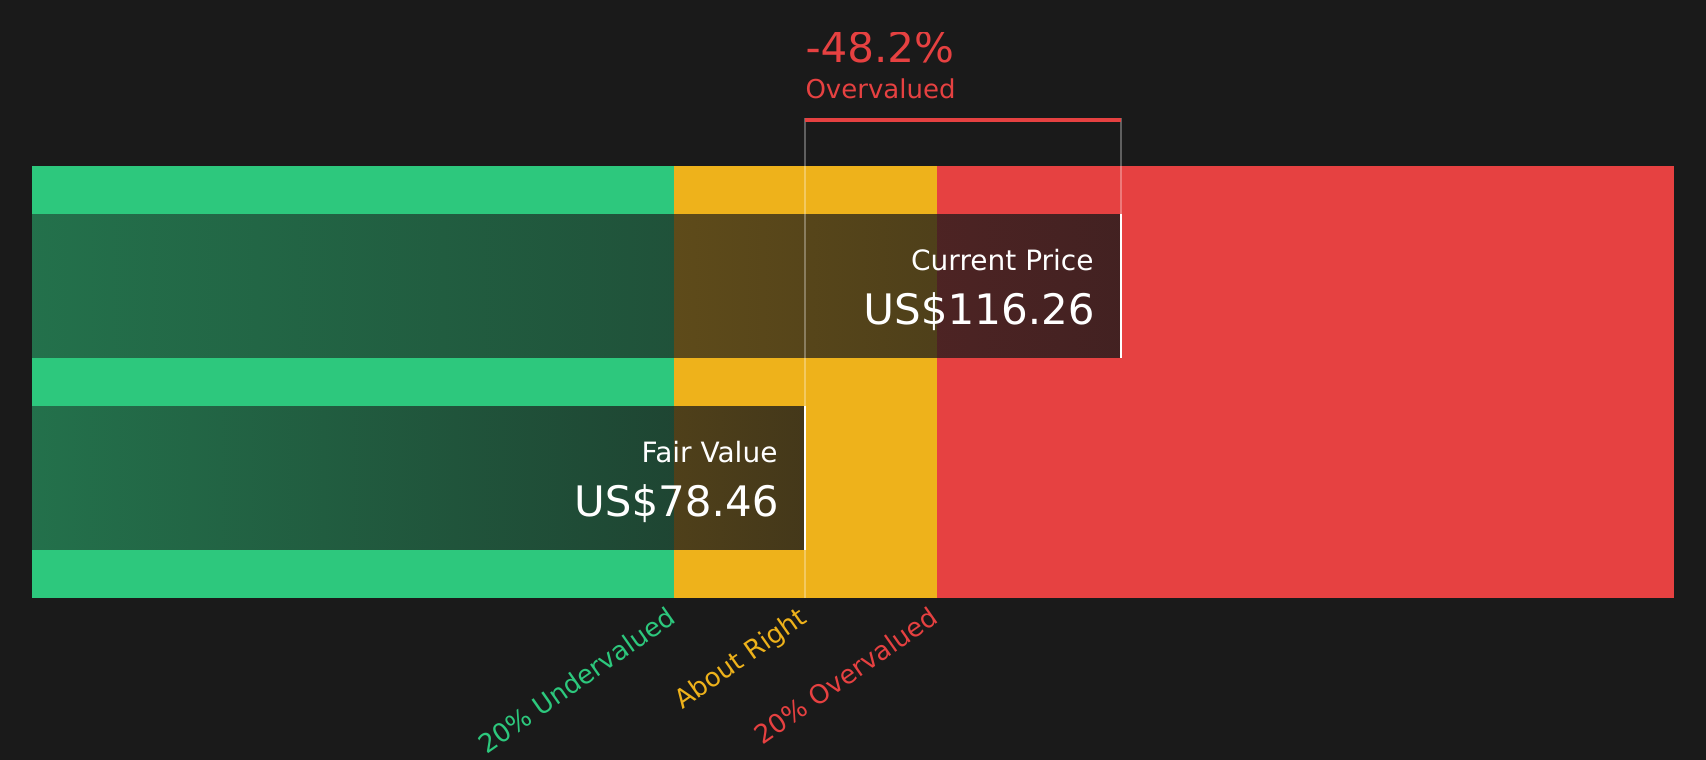
Putting these cash flows together and discounting them back, the DCF model arrives at an estimated intrinsic value of about $78.83 per share for MSC Industrial Direct. Against a current share price around $115, this particular model suggests the stock is about 46.6% above its DCF estimate, which points to a rich valuation on this method alone.
Result: OVERVALUED
Our Discounted Cash Flow (DCF) analysis suggests MSC Industrial Direct may be overvalued by 46.6%. Discover 46 high quality undervalued stocks or create your own screener to find better value opportunities.
Approach 2: MSC Industrial Direct Price vs Earnings
P/E is a common yardstick for profitable companies because it compares what you pay for each share with the earnings that support that share. It helps you judge how much the market is currently willing to pay for US$1 of earnings.
In general, higher growth expectations and lower perceived risk can justify a higher P/E ratio, while slower expected growth or higher risk usually call for a lower, more cautious multiple. That context is important when you compare MSC Industrial Direct’s P/E with its peers.
MSC Industrial Direct currently trades at about 31.07x earnings. This sits above the Trade Distributors industry average of about 24.11x and also above a peer group average of around 22.62x. On these simple comparisons, the stock looks expensively valued relative to many peers.
Simply Wall St’s Fair Ratio for MSC Industrial Direct is 22.17x. This is a proprietary estimate of what the P/E might be based on factors such as earnings growth, profit margins, industry, market cap and specific risks. Because it blends these company specific factors, it can be more tailored than a broad peer or industry comparison. Set against the current P/E of 31.07x, the Fair Ratio suggests the shares are trading on a richer multiple than those fundamentals alone would imply.
Result: OVERVALUED

P/E ratios tell one story, but what if the real opportunity lies elsewhere? Start investing in legacies, not executives. Discover our 20 top founder-led companies.
Upgrade Your Decision Making: Choose Your MSC Industrial Direct Narrative
Earlier it was mentioned that there is an even better way to understand valuation. Narratives take the story you believe about MSC Industrial Direct, link it to specific forecasts for revenue, earnings and margins, and then convert that into a Fair Value you can compare with the current share price.
On Simply Wall St’s Community page, Narratives are an accessible tool used by millions of investors. They let you set your own assumptions instead of relying only on a single DCF or P/E screen, and then see in one place how your Fair Value stacks up against today’s price to help you judge whether the stock looks expensive or cheap on your numbers.
Narratives also refresh when new information arrives, such as earnings results or news. Your Fair Value is updated rather than frozen, which keeps your decision making anchored to the latest data rather than an outdated model.
For MSC Industrial Direct, one investor might build a more optimistic Narrative closer to a US$120 Fair Value that leans on cost savings, In Plant expansion and higher margins. Another investor might use a more cautious Narrative closer to US$67 that focuses on softer demand, tariff risks and pressure on profitability, and the gap between those views shows how much your own assumptions matter.
Do you think there's more to the story for MSC Industrial Direct? Head over to our Community to see what others are saying!

This article by Simply Wall St is general in nature. We provide commentary based on historical data and analyst forecasts only using an unbiased methodology and our articles are not intended to be financial advice. It does not constitute a recommendation to buy or sell any stock, and does not take account of your objectives, or your financial situation. We aim to bring you long-term focused analysis driven by fundamental data. Note that our analysis may not factor in the latest price-sensitive company announcements or qualitative material. Simply Wall St has no position in any stocks mentioned.