

MSCI (MSCI) Could Be 26% Below Fair Value As 2026 Cost Outlook Rises
MSCI Inc. Class A MSCI | 0.00 |
Why MSCI’s Higher 2026 Cost Outlook Matters Now
MSCI (MSCI) recently lifted its 2026 operating expense forecast, citing acquisition-related costs, higher employee incentives, and increased investment spending. This shift has pushed near-term profitability and capital allocation choices into sharper focus for investors.
Over the past quarter MSCI’s share price return fell 9.9%, and the stock is also down over the past month, which suggests some investors are reassessing near term risks as the higher 2026 cost outlook beds in around the current US$564.22 level. At the same time, the 1 year total shareholder return of 0.38% and 3 year total shareholder return of 7.71% indicate a modest overall payoff for longer term holders. However, the negative 5 year total shareholder return of 7.97% shows that long horizon results have been more muted, despite more recent focus on growth investments and acquisitions.
Look beyond MSCI’s higher cost outlook and compare it with a hand picked 51 high quality undervalued stocks that may offer more compelling risk reward trade offs at current levels.
MSCI shares have slipped as investors absorb higher 2026 cost guidance, yet the current US$564.22 price still sits below both analyst targets and intrinsic estimates. What does that gap mean in practical terms for you?
Most Popular Narrative: 26% Undervalued
The most followed narrative on MSCI values the stock at $762.58 per share, which sits well above the last close of $564.22. According to Jobeda, that gap is built on a detailed view of MSCI’s recurring revenue, margins, and operating leverage.
MSCI’s products are largely information and software, rather than physical products. Once the data, methodology and technology infrastructure exist, additional customers can produce very high incremental margins.
That’s why a company producing roughly $800+ million in quarterly revenue can generate EBITDA margins above 60%. Read the complete narrative.
Want to see why this narrative stretches MSCI’s value well beyond current pricing? The core assumptions sit in recurring revenue strength, high margins, and a rich future earnings multiple.
Result: Fair Value of $762.58 (UNDERVALUED)
However, MSCI’s story can change quickly if cost growth outpaces revenue or if clients push back on pricing for its index and analytics products.
Another View On MSCI Using Market Ratios
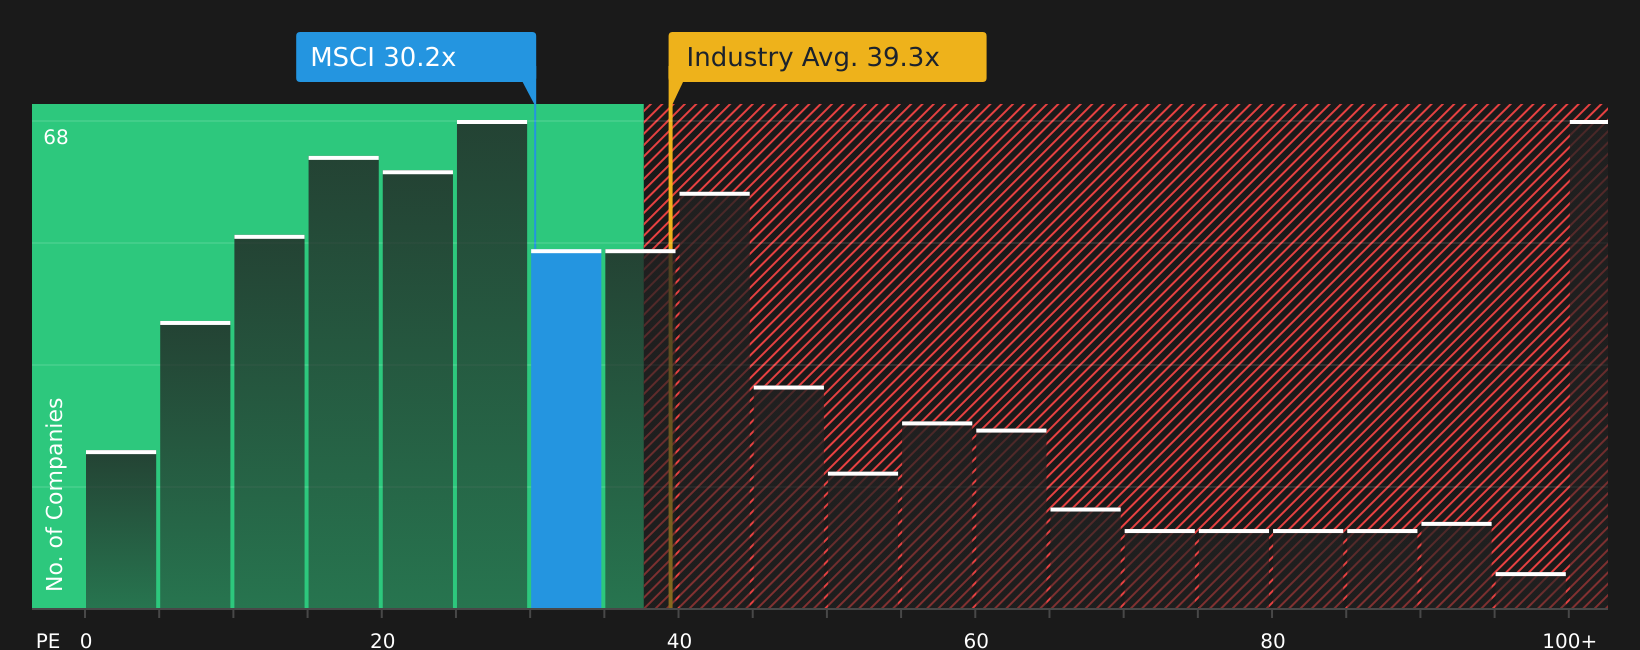
There is a different read on MSCI if you look at plain P/E ratios instead of narrative fair values. The stock trades on 30.2x earnings, which is higher than peers at 27.4x and well above a fair ratio of 17x. That points to valuation risk if sentiment cools.
On the other hand, MSCI’s 30.2x P/E is below the wider US Capital Markets average of 39.3x. Investors weighing these mixed signals may want to ask whether they are being paid enough for the extra volatility that could come if the market moves closer to that lower fair ratio level.
Next Steps
If this mix of optimism and concern around MSCI feels familiar, now is the time to look at the numbers yourself and move quickly to your own view. To see how the potential risks balance against the possible rewards, review the 5 key rewards and 1 important warning sign
Looking for more investment ideas beyond MSCI?
If MSCI has sharpened your focus on quality and price, now is the moment to cast a wider net and find opportunities that fit your style.
- Spot potential high risk, high reward setups by checking out 23 elite penny stocks with strong financials that match your appetite for smaller companies.
- Focus on companies with robust fundamentals and pricing that may appeal at current levels by reviewing the list of solid balance sheet and fundamentals (51 results).
- Look for under the radar opportunities by scanning the 20 high quality undiscovered gems before they attract broader attention.
This article by Simply Wall St is general in nature. We provide commentary based on historical data and analyst forecasts only using an unbiased methodology and our articles are not intended to be financial advice. It does not constitute a recommendation to buy or sell any stock, and does not take account of your objectives, or your financial situation. We aim to bring you long-term focused analysis driven by fundamental data. Note that our analysis may not factor in the latest price-sensitive company announcements or qualitative material. Simply Wall St has no position in any stocks mentioned.