

Navigator Holdings (NVGS) Posts Record Q2 Earnings, Is The Valuation Upside Already Priced In?
Navigator Holdings Ltd. NVGS | 0.00 |
Navigator Holdings (NVGS) just posted record Q2 2026 net income and EBITDA, supported by stronger charter rates tied to geopolitical disruptions near key shipping routes and higher terminal activity, while also progressing vessel sales and shareholder returns.
At a share price of $20.72, Navigator Holdings has seen short term share price returns ease in recent weeks, while its year to date share price return of 19.42% and 1 year total shareholder return of 34.75% suggest longer term momentum has held up.
If record earnings in gas shipping have caught your attention, it could be a useful moment to see what else is moving in related infrastructure and logistics through the 35 power grid technology and infrastructure stocks
Recent gains in Navigator Holdings look tied to record earnings, not just a mood shift in shipping stocks. How does that recent move stack up against what you actually pay for the business today?
Price-to-Earnings of 9.1x: Is it justified?
Navigator Holdings closed at $20.72 with a P/E of 9.1x, which current data suggests screens as good value relative to several benchmarks, yet not outright cheap against every yardstick.
The P/E ratio compares the company’s share price to its earnings per share. For a business like Navigator Holdings, which runs liquefied gas carriers and related services, it gives you a quick sense of how much you are paying for each dollar of profit.
On one hand, the stock is described as good value on a P/E of 9.1x when lined up against both the US Oil and Gas industry average of 12.7x and a peer group average of 22.4x. On the other hand, the same P/E is described as expensive versus an estimated fair P/E of 7.3x, which is a level the market could move towards if sentiment or earnings expectations cool.
This mix of signals means the multiple looks low against the wider sector and peers, yet above the fair ratio estimate that anchors valuation more tightly to fundamentals. Explore the SWS fair ratio for Navigator Holdings
Result: Price-to-Earnings of 9.1x (ABOUT RIGHT)
However, you still need to weigh risks such as softer revenue and net income trends, along with share price weakness over the past quarter, which could challenge the current Navigator Holdings story.
Another View on Navigator Holdings Using Cash Flows
The P/E of 9.1x paints one picture for Navigator Holdings. Our DCF model tells a different story. On this view, the stock at $20.72 trades at roughly a 47% discount to an estimated future cash flow value of $39.03. Which signal should carry more weight for you?
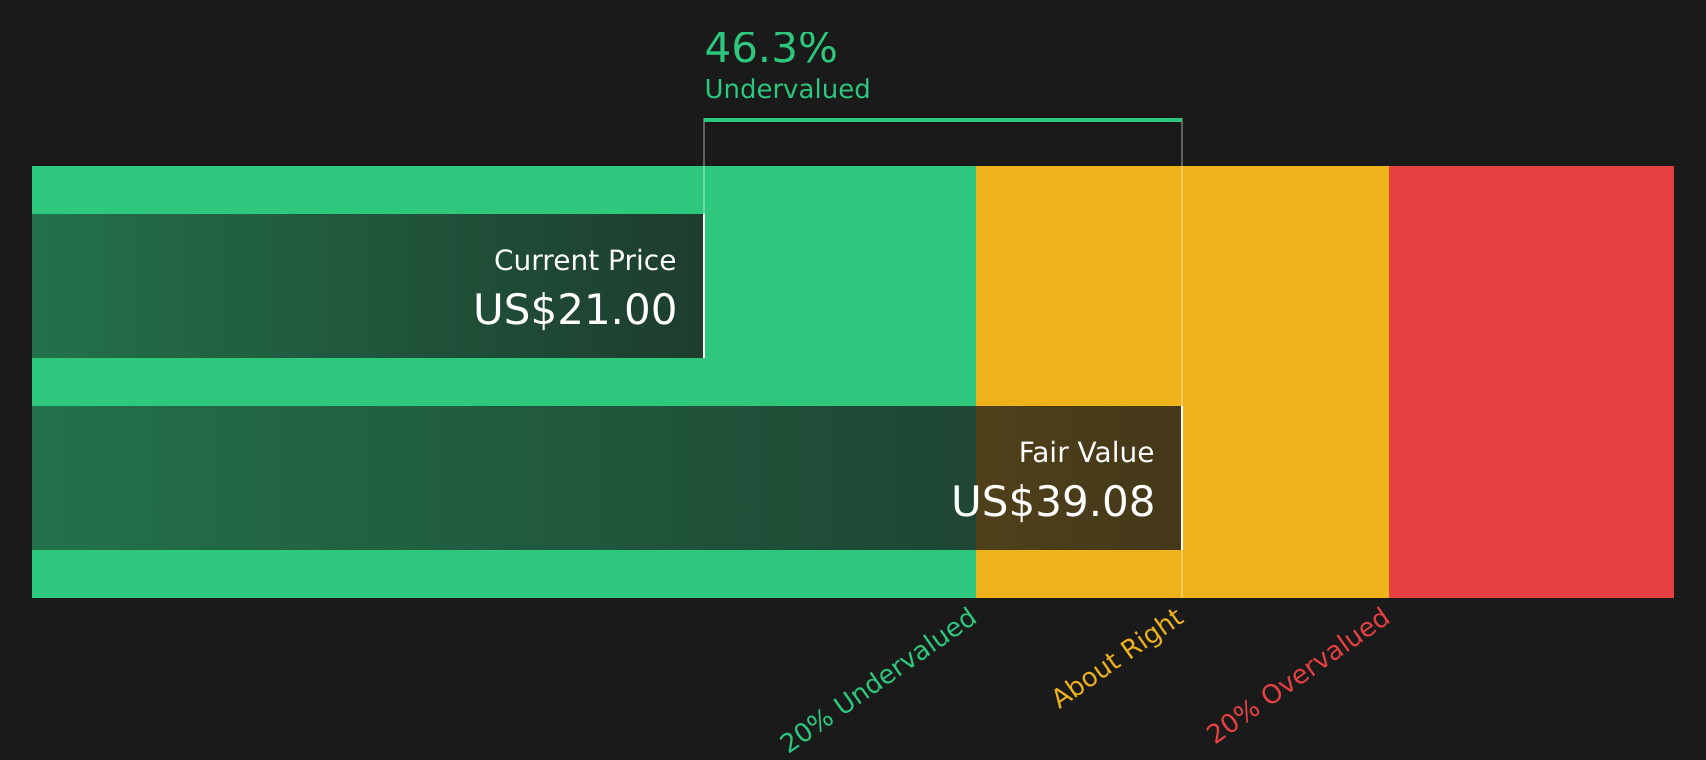
Simply Wall St performs a discounted cash flow (DCF) on every stock in the world every day (check out Navigator Holdings for example). We show the entire calculation in full. You can track the result in your watchlist or portfolio and be alerted when this changes, or use our stock screener to discover 51 high quality undervalued stocks. If you save a screener we even alert you when new companies match - so you never miss a potential opportunity.
Next Steps
Mixed signals around Navigator Holdings can feel confusing, so it helps to move quickly and test the story against the data yourself. You can weigh both the concerns and the upside by checking the 3 key rewards and 4 important warning signs
Looking for more investment ideas beyond Navigator Holdings?
If Navigator Holdings has sharpened your focus, do not stop here. Broaden your watchlist with other ideas that match clear financial qualities and targeted return profiles.
- Spot potential mispriced opportunities early and check out the 51 high quality undervalued stocks before others move first.
- Strengthen the defensive side of your portfolio and review the 88 resilient stocks with low risk scores while conditions still favor resilient companies.
- Get ahead of the crowd by scanning the screener containing 18 high quality undiscovered gems that might not stay under the radar for long.
This article by Simply Wall St is general in nature. We provide commentary based on historical data and analyst forecasts only using an unbiased methodology and our articles are not intended to be financial advice. It does not constitute a recommendation to buy or sell any stock, and does not take account of your objectives, or your financial situation. We aim to bring you long-term focused analysis driven by fundamental data. Note that our analysis may not factor in the latest price-sensitive company announcements or qualitative material. Simply Wall St has no position in any stocks mentioned.