

Nelnet (NNI) Following Its Earnings Miss Is The Stock Fully Valued
Nelnet, Inc. Class A NNI | 0.00 |
Nelnet (NNI) is back in focus after reporting quarterly revenue of $353.2 million, a decline of 7.1% year on year. This result missed expectations and coincided with a 6.1% share price decline since the earnings release.
Zooming out from the latest quarter, Nelnet’s 1-year total shareholder return of 6.2% and 3-year total shareholder return of 41.1% suggest longer term holders have still seen gains, even as near term share price momentum has cooled.
If this earnings reaction has you thinking about where else growth or stability might be hiding, it could be a useful moment to scan 18 top founder-led companies
Nelnet runs a broad set of fee and interest based businesses, yet the recent earnings miss and share pullback put the focus on a different issue: is the stock already pricing in that strength or not?
Price-to-Earnings of 11.4x: Is it justified?
Based on the preferred P/E multiple, Nelnet trades at 11.4x earnings, which puts the current $132.51 share price at a premium to several benchmarks.
The P/E ratio compares what investors are paying today for each dollar of current earnings, so it is a quick way to see how the market is rating Nelnet against other options in the US market and within consumer finance.
Here, the picture is mixed. On one hand, Nelnet’s P/E of 11.4x sits below the wider US market at 19.1x, which points to a lower earnings multiple than the market average. On the other hand, that same 11.4x is higher than both the US Consumer Finance industry average of 8.7x and the estimated fair P/E of 9.7x. This suggests investors are paying up relative to sector peers and to the level our fair ratio model indicates the market could move towards.
Result: Price-to-Earnings of 11.4x (OVERVALUED)
However, Nelnet’s falling annual net income growth and the gap between its current P/E and the sector average could pressure sentiment if profitability or sector expectations reset.
Another View: What Our DCF Model Says About Nelnet
While the P/E ratio suggests Nelnet trades at a premium to its sector, the SWS DCF model points in an even harsher direction. With the stock at $132.51 and our DCF value at $22.60, the model frames Nelnet as heavily overvalued and raises questions about how much optimism is already in the price.
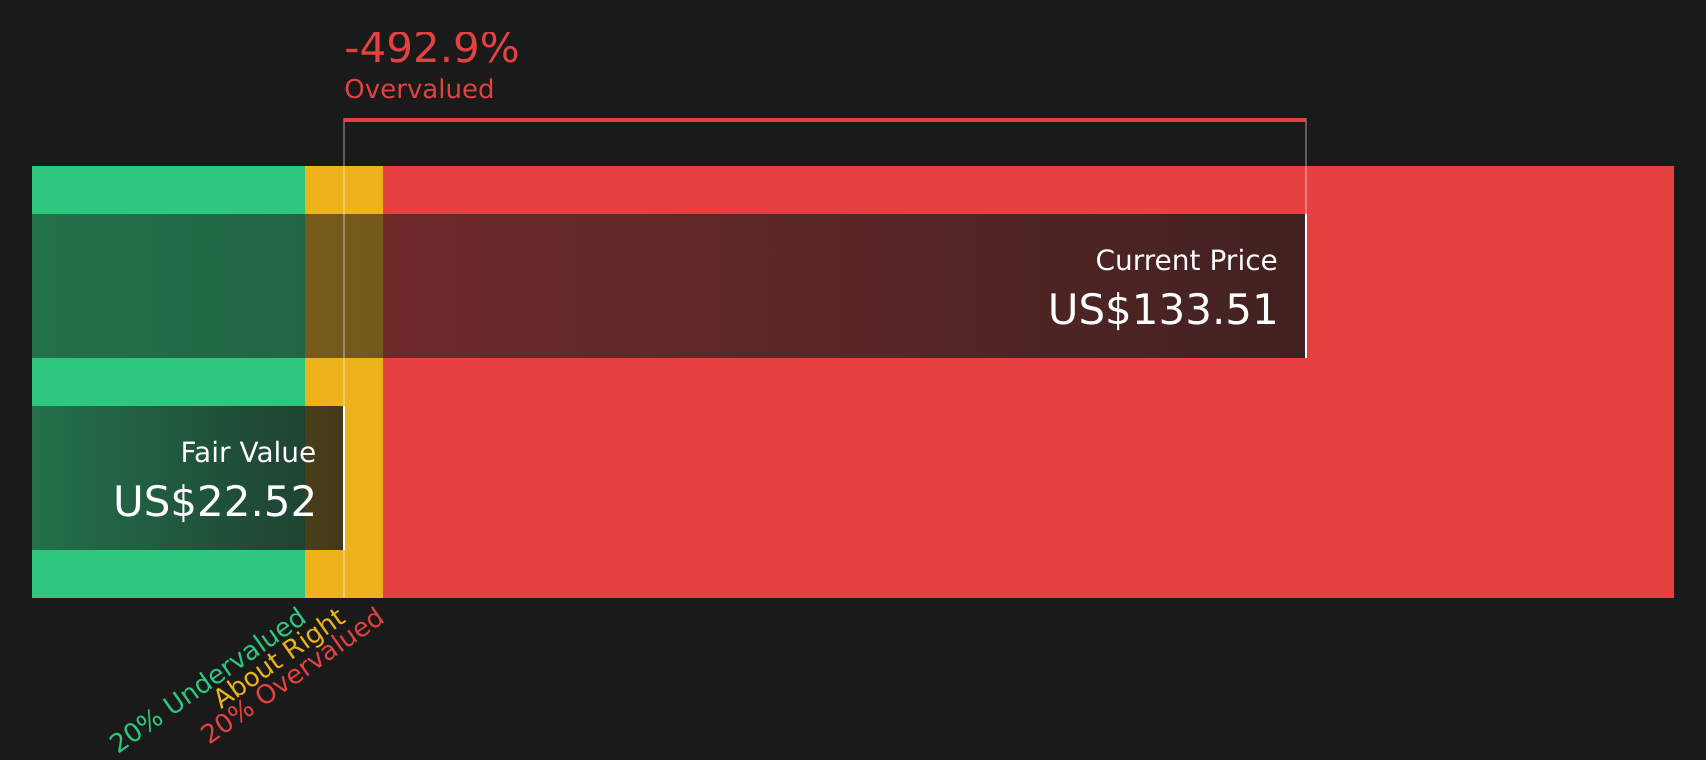
Simply Wall St performs a discounted cash flow (DCF) on every stock in the world every day (check out Nelnet for example). We show the entire calculation in full. You can track the result in your watchlist or portfolio and be alerted when this changes, or use our stock screener to discover 44 high quality undervalued stocks. If you save a screener we even alert you when new companies match - so you never miss a potential opportunity.
Next Steps
If this mix of signals around Nelnet feels conflicted, take it as a cue to review the data, consider both potential benefits and risks, and form your own judgment with support from the 2 key rewards and 2 important warning signs
Looking for more investment ideas beyond Nelnet?
Do not let your view on Nelnet be your only move. Use this moment to line up fresh ideas that match the kind of portfolio you actually want.
- Hunt for quality at a discount by scanning 44 high quality undervalued stocks that combine solid fundamentals with pricing that may not fully reflect their strengths.
- Strengthen your income focus by checking 9 dividend fortresses that offer higher yields while still paying attention to balance sheets and cash flows.
- Protect your downside first by reviewing 73 resilient stocks with low risk scores that aim for resilience when conditions get tougher.
This article by Simply Wall St is general in nature. We provide commentary based on historical data and analyst forecasts only using an unbiased methodology and our articles are not intended to be financial advice. It does not constitute a recommendation to buy or sell any stock, and does not take account of your objectives, or your financial situation. We aim to bring you long-term focused analysis driven by fundamental data. Note that our analysis may not factor in the latest price-sensitive company announcements or qualitative material. Simply Wall St has no position in any stocks mentioned.