NETSTREIT (NTST) Stock Could Be 69% Below Fair Value After Fresh Buy Ratings
NETSTREIT Corp. NTST | 0.00 |
Recent buy ratings from Jefferies and Truist have pushed NETSTREIT (NTST) into focus, as both firms pointed to the company’s execution on its investment pipeline and its expectations for higher acquisition activity.
Against this backdrop, NETSTREIT’s share price of $19.42 sits on a year to date share price return of 9.29%, while its 1 year total shareholder return of 19.90% reflects steady, income supported momentum rather than a sharp re rating.
If this kind of interest in NETSTREIT has you curious about what else is out there, it could be a good moment to scan for other ideas using the 20 top founder-led companies
So with NETSTREIT trading at $19.42, sitting on a 19.90% 1 year total return and standing at a reported 69% discount to an intrinsic estimate, is there still an opening here, or is the market already pricing in future growth?
Preferred Price-to-Sales of 9.2x: Is It Justified for NETSTREIT?
On the numbers available, NETSTREIT looks expensive on a preferred multiple basis, with a P/S ratio of 9.2x sitting against a last close of $19.42 despite the stock showing a 19.90% 1 year total return.
The P/S ratio compares the company’s market value with its $206.2m in revenue. A higher multiple means investors are paying more for each dollar of rental income NETSTREIT generates. For a retail REIT focused on single tenant net lease properties, this often reflects what the market is willing to pay for perceived cash flow resilience and growth in that rent base.
Relative to peers, the current 9.2x P/S stands well above both the US Retail REITs industry average of 6.9x and the peer group average of 6.8x. It is also richer than the estimated fair P/S ratio of 7.6x that our model suggests the market could move towards over time.
Result: Price-to-Sales of 9.2x (OVERVALUED)
However, NETSTREIT’s premium 9.2x P/S and 69% implied discount rely on steady rental income and acquisition execution, both of which could face tenant or transaction setbacks.
Another View on NETSTREIT: DCF Points the Other Way
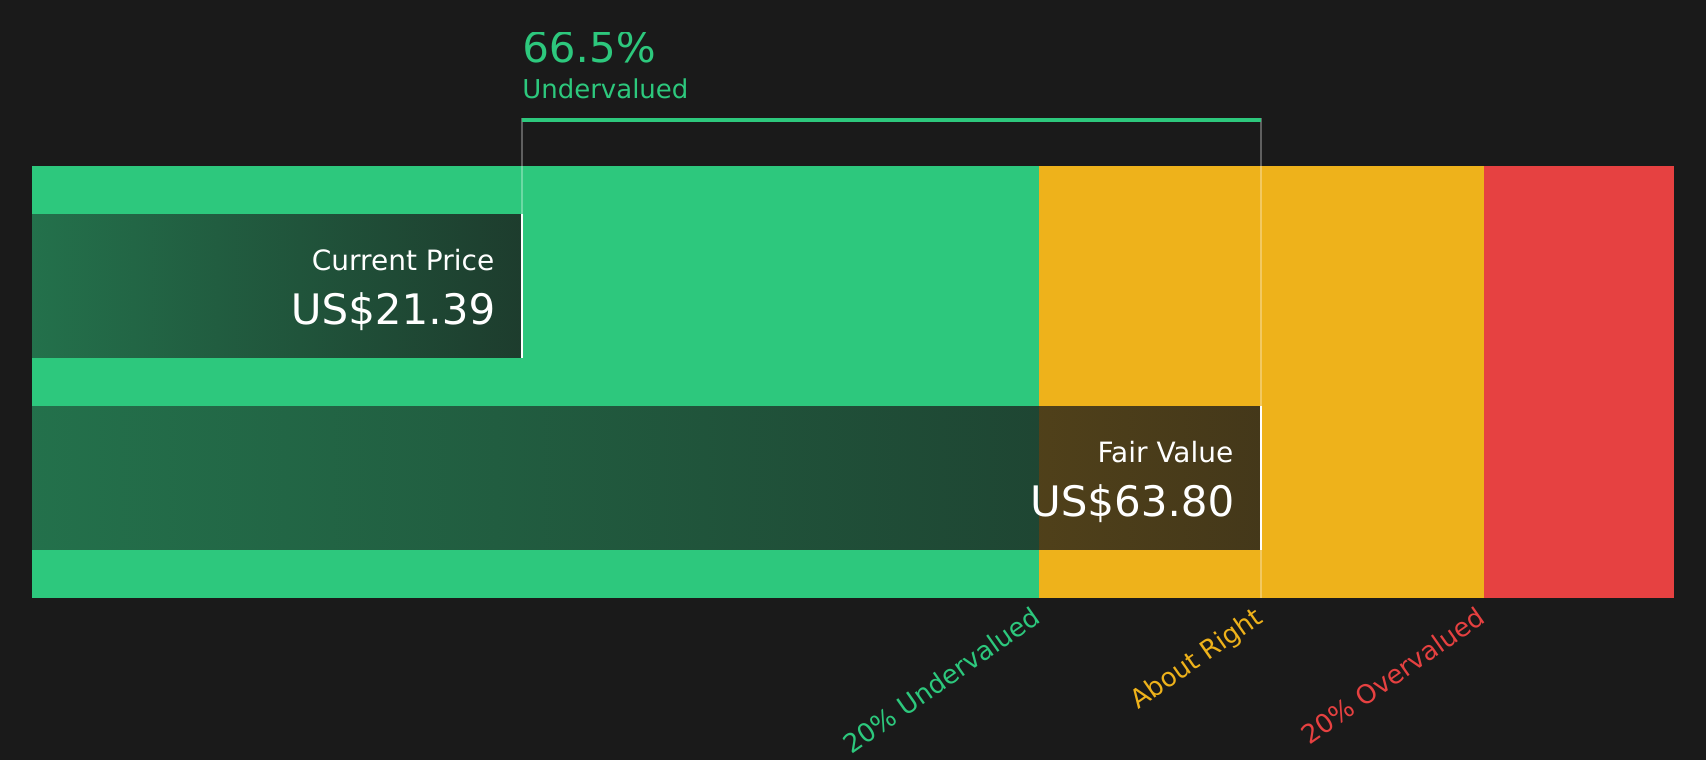
While NETSTREIT looks expensive on a 9.2x P/S ratio, our DCF model presents a contrasting view. It shows an estimated future cash flow value of $63.16 per share compared to today’s $19.42 price, which suggests the stock trades at a reported 69.3% discount. Which signal matters more to you?
Simply Wall St performs a discounted cash flow (DCF) on every stock in the world every day (check out NETSTREIT for example). We show the entire calculation in full. You can track the result in your watchlist or portfolio and be alerted when this changes, or use our stock screener to discover 44 high quality undervalued stocks. If you save a screener we even alert you when new companies match - so you never miss a potential opportunity.
Next Steps
Balanced or conflicted by what NETSTREIT’s signals are showing? Act quickly, consider both sides of the story, and weigh the 3 key rewards and 3 important warning signs.
Looking for more investment ideas beyond NETSTREIT?
If NETSTREIT has sharpened your focus on quality opportunities, do not stop here. Broaden your watchlist with fresh ideas that match your style and risk comfort.
- Spot potential value opportunities early by checking out 44 high quality undervalued stocks which combine quality fundamentals with attractive pricing.
- Prioritise resilience by scanning 66 resilient stocks with low risk scores which score well on stability so you are not caught off guard when conditions change.
- Get ahead of the crowd by reviewing the screener containing 19 high quality undiscovered gems before they land on everyone else’s radar.
This article by Simply Wall St is general in nature. We provide commentary based on historical data and analyst forecasts only using an unbiased methodology and our articles are not intended to be financial advice. It does not constitute a recommendation to buy or sell any stock, and does not take account of your objectives, or your financial situation. We aim to bring you long-term focused analysis driven by fundamental data. Note that our analysis may not factor in the latest price-sensitive company announcements or qualitative material. Simply Wall St has no position in any stocks mentioned.