Nucor (NUE) Valuation Check After Strong Q4 Results And Earnings Growth Outlook
Nucor Corporation NUE | 191.85 | +1.19% |
Nucor (NUE) is back in focus after reporting fourth quarter 2025 results showing higher sales and net income than a year earlier, along with guidance calling for first quarter earnings growth across all segments.
The earnings update comes after a strong run in Nucor’s share price, with a 30 day share price return of 17.01% and a 90 day share price return of 33.63%. The 1 year total shareholder return of 50.46% points to momentum that has been building rather than fading.
If this steel rally has you thinking about related opportunities in materials and infrastructure, it could be worth scanning our 7 top copper producer stocks as a starting point for other metal producers to research.
With Nucor up 50.5% over the past year and trading slightly above the average analyst price target, the key question now is whether that 62.8% intrinsic discount suggests more upside or if the market is already pricing in future growth.
Most Popular Narrative: 5.7% Overvalued
With Nucor last closing at $192.84 against a most followed fair value estimate of $182.38, the current price sits a little above that narrative anchor, putting more focus on what is built into the long term story.
The analysts have a consensus price target of $159.75 for Nucor based on their expectations of its future earnings growth, profit margins and other risk factors. However, there is a degree of disagreement amongst analysts, with the most bullish reporting a price target of $182.0, and the most bearish reporting a price target of just $145.0.
Curious what justifies a fair value above that earlier consensus target range? The narrative leans heavily on faster earnings growth, higher margins, and a valuation multiple that assumes those improvements actually stick.
Result: Fair Value of $182.38 (OVERVALUED)
However, shifting trade policies and any stumble in bringing new mills and projects online could quickly challenge the earnings and margin assumptions behind that fair value story.
Another View: Cash Flows Tell a Different Story
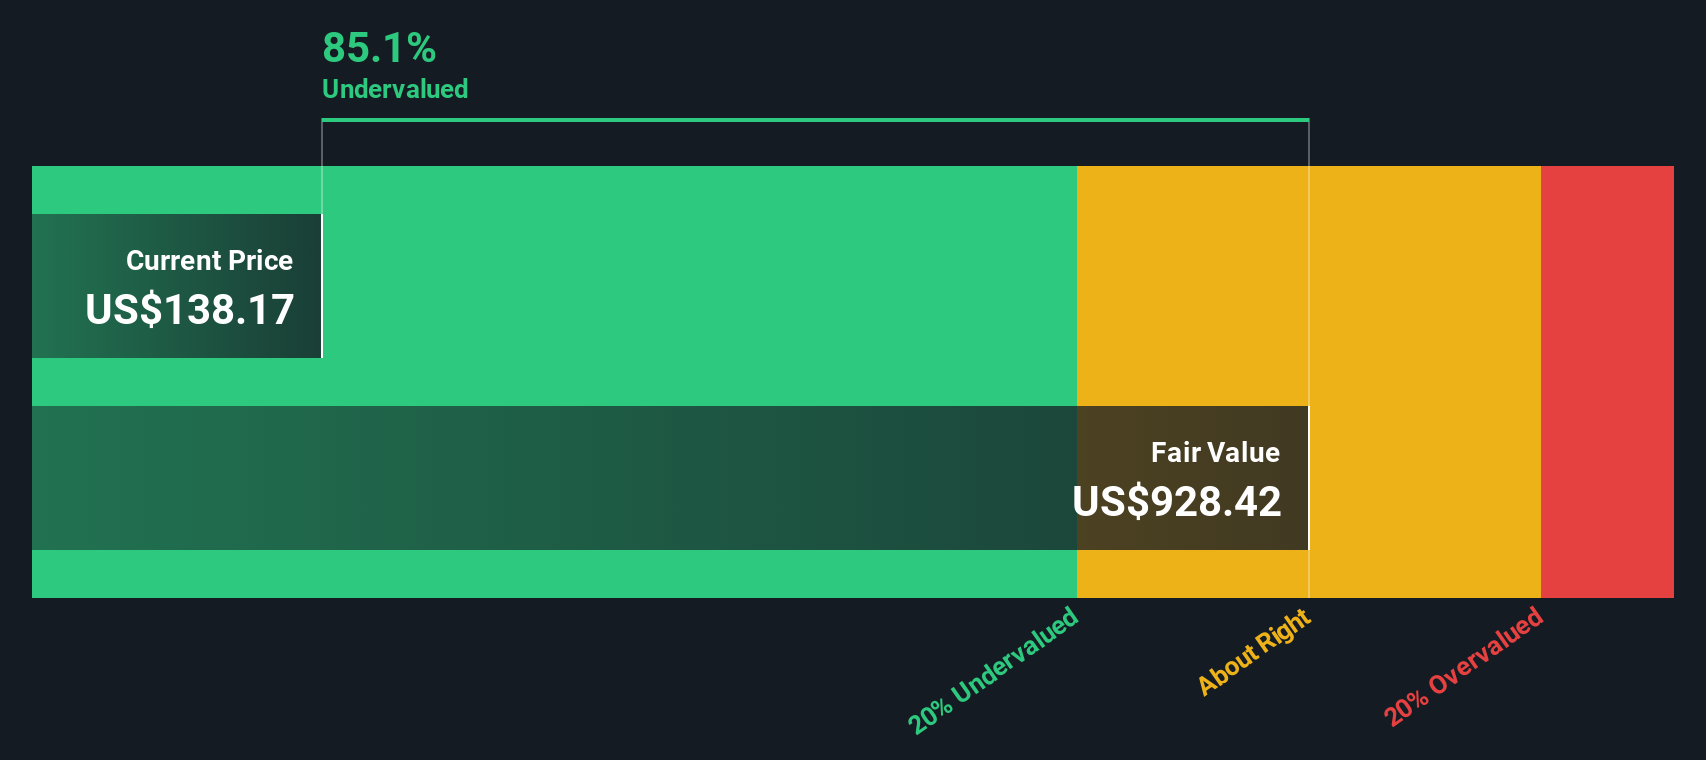
While the popular narrative suggests Nucor is 5.7% overvalued at a fair value of $182.38, our DCF model offers a different perspective, with an estimated future cash flow value of $518.98 per share and the stock trading at a 62.8% discount. Which story do you think better reflects reality?
Simply Wall St performs a discounted cash flow (DCF) on every stock in the world every day (check out Nucor for example). We show the entire calculation in full. You can track the result in your watchlist or portfolio and be alerted when this changes, or use our stock screener to discover 53 high quality undervalued stocks. If you save a screener we even alert you when new companies match - so you never miss a potential opportunity.
Build Your Own Nucor Narrative
If you are not sold on either of these views or prefer to stress test the assumptions yourself, you can build a custom narrative in minutes by starting with Do it your way.
A great starting point for your Nucor research is our analysis highlighting 2 key rewards and 1 important warning sign that could impact your investment decision.
Looking for more investment ideas?
If you are serious about putting this research to work, do not stop at one stock. Broaden your watchlist with focused ideas pulled from the Simply Wall St screener.
- Target potential mispricings by scanning our 53 high quality undervalued stocks, which filters for companies combining solid fundamentals with prices that may not fully reflect their underlying strength.
- Explore potential income ideas through our 14 dividend fortresses, featuring companies with yields above 5% that some investors use when building more income focused portfolios.
- Protect against unwanted surprises by checking 86 resilient stocks with low risk scores, a shortlist of companies that score well on financial stability and business risk measures.
This article by Simply Wall St is general in nature. We provide commentary based on historical data and analyst forecasts only using an unbiased methodology and our articles are not intended to be financial advice. It does not constitute a recommendation to buy or sell any stock, and does not take account of your objectives, or your financial situation. We aim to bring you long-term focused analysis driven by fundamental data. Note that our analysis may not factor in the latest price-sensitive company announcements or qualitative material. Simply Wall St has no position in any stocks mentioned.