

PACS Group (PACS) Is Up 5.3% After Raising 2026 Revenue Outlook On Strong Q2 Results
PACS Group, Inc. PACS | 0.00 |
- PACS Group, Inc. recently reported its second-quarter 2026 results, with revenue rising to US$1,428 million and net income reaching US$76.37 million, and at the same time raised full-year 2026 revenue guidance to a range of US$5.75 billion to US$5.85 billion.
- The company also highlighted occupancy levels above 90% and plans for additional facility acquisitions, indicating that its locally led, centrally supported model is supporting higher utilization and expansion across its skilled nursing and post‑acute care network.
- We’ll now examine how the upgraded 2026 revenue and EBITDA guidance may influence PACS Group’s investment narrative and future expectations.
The future of work is here. Discover the 36 top robotics and automation stocks leading the charge in AI-driven automation and industrial transformation.
PACS Group Investment Narrative Recap
To own PACS Group, I think you need to believe its locally led, centrally supported model can keep lifting occupancy and margins while it absorbs a very large wave of recent acquisitions. The upgraded 2026 revenue and EBITDA guidance reinforces the near term catalyst of stronger utilization and scale benefits, while integration risk across newer, lower margin facilities remains the central concern and is not materially reduced by this single guidance raise.
The most relevant recent announcement here is PACS Group’s higher full year 2026 revenue guidance to US$5.75 billion to US$5.85 billion, which directly reflects the Q2 result and sustained occupancy above 90 percent. This updated range ties the investment story more tightly to execution on bringing new facilities closer to mature cohort performance, making it more important for investors to watch how quickly ramping properties contribute to revenue and EBITDA over the next few quarters.
Yet even with stronger guidance, investors should be aware that heavy dependence on key state reimbursement structures could...
PACS Group's narrative projects $7.2 billion revenue and $461.5 million earnings by 2029. This requires 8.9% yearly revenue growth and about a $192 million earnings increase from $269.2 million today.
Uncover how PACS Group's forecasts yield a $59.75 fair value, a 23% upside to its current price.
Exploring Other Perspectives
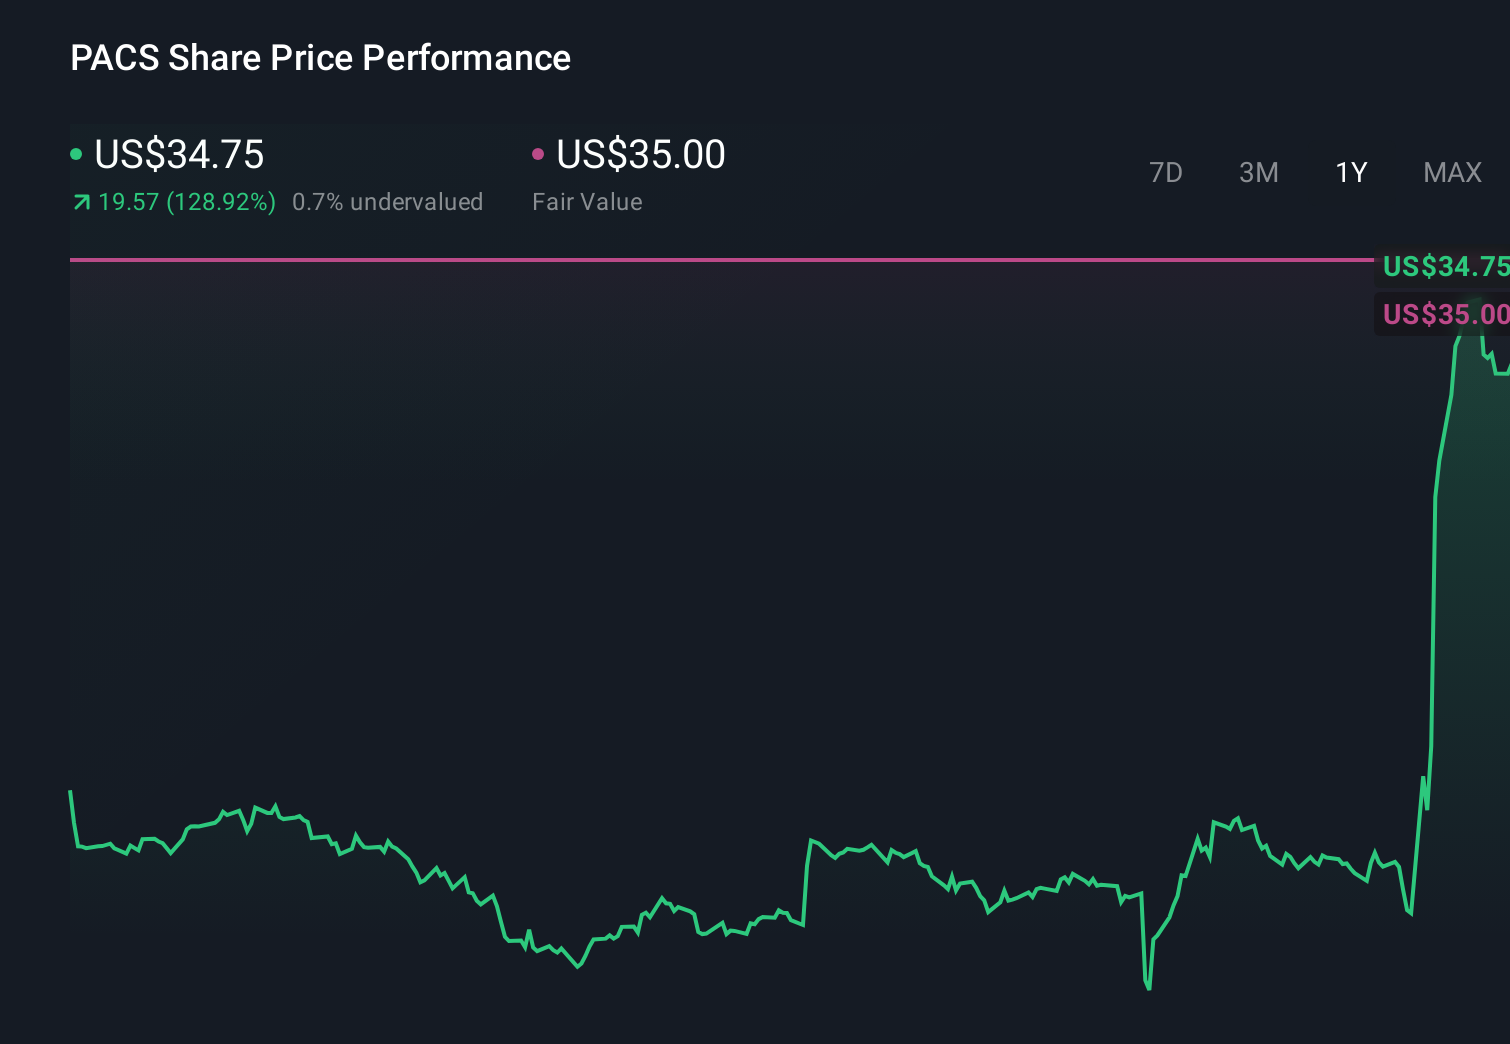
Three members of the Simply Wall St Community currently estimate PACS Group’s fair value between US$57.40 and US$80.34, showing a wide span of expectations. Set against raised 2026 guidance and high occupancy, this spread underlines how differently investors weigh acquisition integration risks and invites you to compare several viewpoints on the company’s trajectory.
Explore 3 other fair value estimates on PACS Group - why the stock might be worth as much as 66% more than the current price!
Reach Your Own Conclusion
Don't just follow the ticker - dig into the data and build a conviction that's truly your own.
- A great starting point for your PACS Group research is our analysis highlighting 3 key rewards and 1 important warning sign that could impact your investment decision.
- Our free PACS Group research report provides a comprehensive fundamental analysis summarized in a single visual - the Snowflake - making it easy to evaluate PACS Group's overall financial health at a glance.
Curious About Other Options?
Markets shift fast. These stocks won't stay hidden for long. Get the list while it matters:
- Find 51 companies with promising cash flow potential yet trading below their fair value.
- AI is about to change healthcare. These 43 stocks are working on everything from early diagnostics to drug discovery. The best part - they are all under $10b in market cap - there's still time to get in early.
- We've uncovered the 8 dividend fortresses yielding 5%+ that don't just survive market storms, but thrive in them.
This article by Simply Wall St is general in nature. We provide commentary based on historical data and analyst forecasts only using an unbiased methodology and our articles are not intended to be financial advice. It does not constitute a recommendation to buy or sell any stock, and does not take account of your objectives, or your financial situation. We aim to bring you long-term focused analysis driven by fundamental data. Note that our analysis may not factor in the latest price-sensitive company announcements or qualitative material. Simply Wall St has no position in any stocks mentioned.