

Parsons (PSN) Wins Fresh Defense Work After Shares Fell, But Is The Valuation Already Rich
Parsons PSN | 0.00 |
Parsons (PSN) is back in focus after a series of new U.S. defense awards, including a US$70 million ceiling task order for Air Base Air Defense and an initial task order under DTRA’s Cooperative Threat Reduction Integration Contract IV.
Despite these contract wins, Parsons’ recent share price return is weaker, with the stock down 11.92% over the past month and 23.50% year to date, while the 5 year total shareholder return of 35.05% still reflects a positive longer term outcome.
If you are looking beyond Parsons and want to see what else is shaping defense and infrastructure, take a look at 35 power grid technology and infrastructure stocks
Parsons is winning fresh US$ contracts while the share price has fallen sharply this year. Is that drop a fair read on the business, or has sentiment swung further than the fundamentals justify as investors reassess valuation?
Price-to-Earnings of 32.3x: Is it justified?
On Simply Wall St’s preferred measure, Parsons trades on a P/E of 32.3x, which screens as expensive against both its peer group and the broader Professional Services industry.
The P/E ratio compares Parsons’ share price to its earnings per share. For a company that earns the bulk of its revenue from long term federal contracts and critical infrastructure work, this multiple reflects what the market is currently willing to pay for each dollar of earnings.
Parsons is considered good value relative to its estimated fair P/E of 34.9x, which means the current P/E is below a level the market could potentially move toward over time. However, the stock trades at a premium compared to the peer average of 17.4x and the US Professional Services industry average of 21.5x, so the market is putting a relatively rich price on Parsons’ earnings versus many competitors.
Result: Price-to-Earnings of 32.3x (OVERVALUED).
However, investors also need to weigh risks such as Parsons’ exposure to federal budgets and the stock’s sharp 40.24% decline in one-year total return.
Another View on Parsons Using Cash Flows
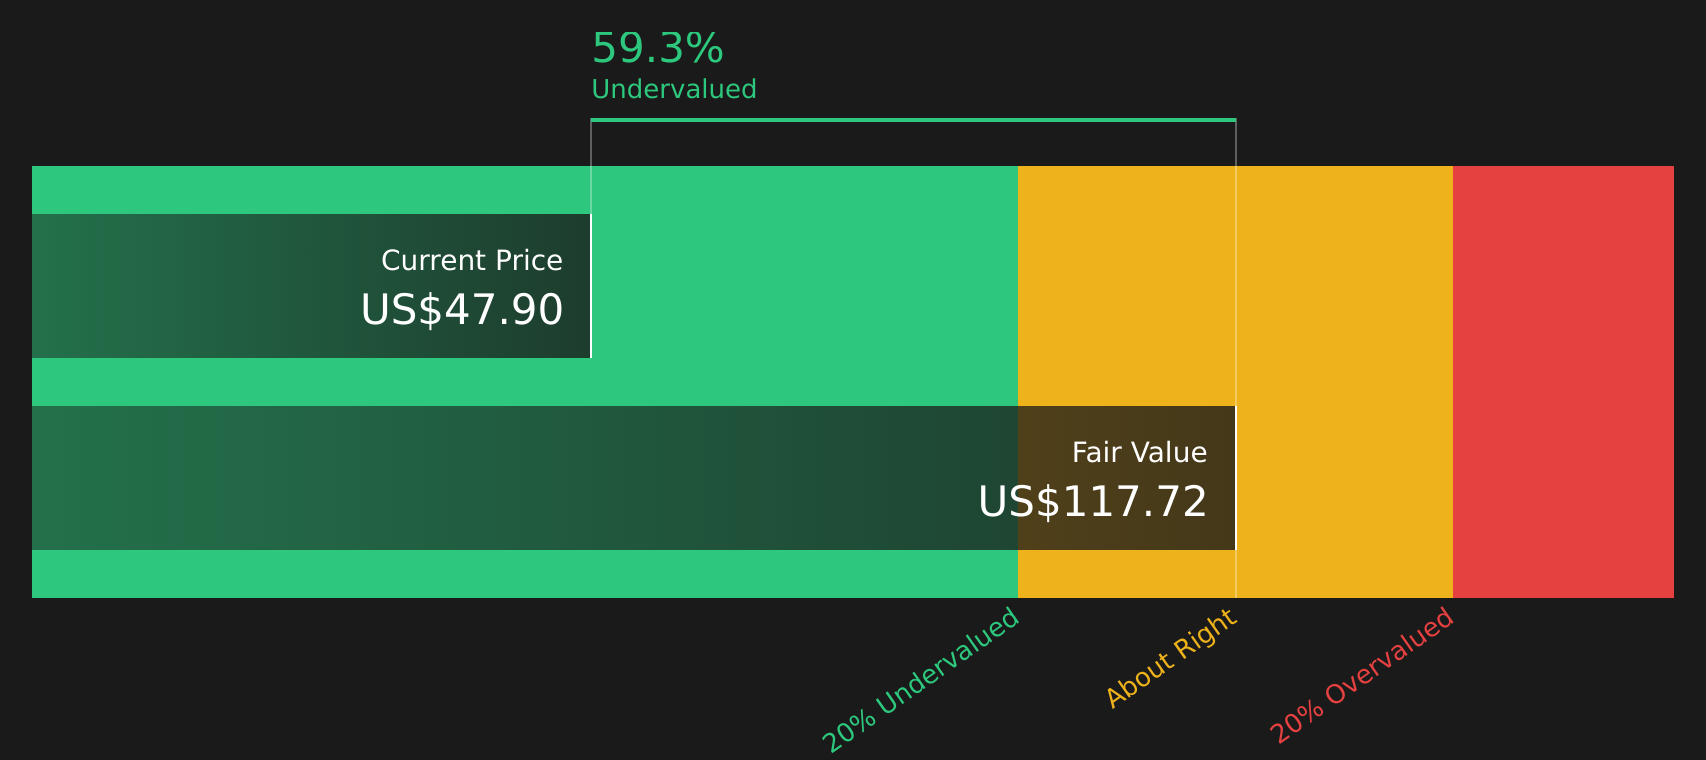
The P/E suggests Parsons screens as expensive, yet the SWS DCF model points the other way. At a share price of $47.59, the stock is described as trading about 59.7% below an estimated future cash flow value of $118.20. Which signal should carry more weight for you?
For investors who want to understand how this gap is calculated and what needs to go right for it to close, Look into how the SWS DCF model arrives at its fair value.
Simply Wall St performs a discounted cash flow (DCF) on every stock in the world every day (check out Parsons for example). We show the entire calculation in full. You can track the result in your watchlist or portfolio and be alerted when this changes, or use our stock screener to discover 51 high quality undervalued stocks. If you save a screener we even alert you when new companies match - so you never miss a potential opportunity.
Next Steps
Given the mixed signals around Parsons right now, it makes sense to look at the data directly and form your own view. To see both sides of the story in one place, review the 3 key rewards and 3 important warning signs
Looking for more investment ideas beyond Parsons?
If Parsons has sharpened your focus on quality, do not stop here. Broaden your watchlist with other ideas that could suit different goals and risk levels.
- Target potential mispriced opportunities by scanning 51 high quality undervalued stocks that pair solid fundamentals with more modest expectations from the market.
- Strengthen your income playbook by reviewing 11 dividend fortresses that aim to combine higher yields with resilient operations.
- Dial back risk while staying invested by checking 88 resilient stocks with low risk scores that score well on stability and financial strength.
This article by Simply Wall St is general in nature. We provide commentary based on historical data and analyst forecasts only using an unbiased methodology and our articles are not intended to be financial advice. It does not constitute a recommendation to buy or sell any stock, and does not take account of your objectives, or your financial situation. We aim to bring you long-term focused analysis driven by fundamental data. Note that our analysis may not factor in the latest price-sensitive company announcements or qualitative material. Simply Wall St has no position in any stocks mentioned.