Phillips Edison (PECO) Q3 Steady FFO Profile Tests Bulls’ High Multiple Narrative
Phillips Edison & Company, Inc. PECO | 37.53 | +0.78% |
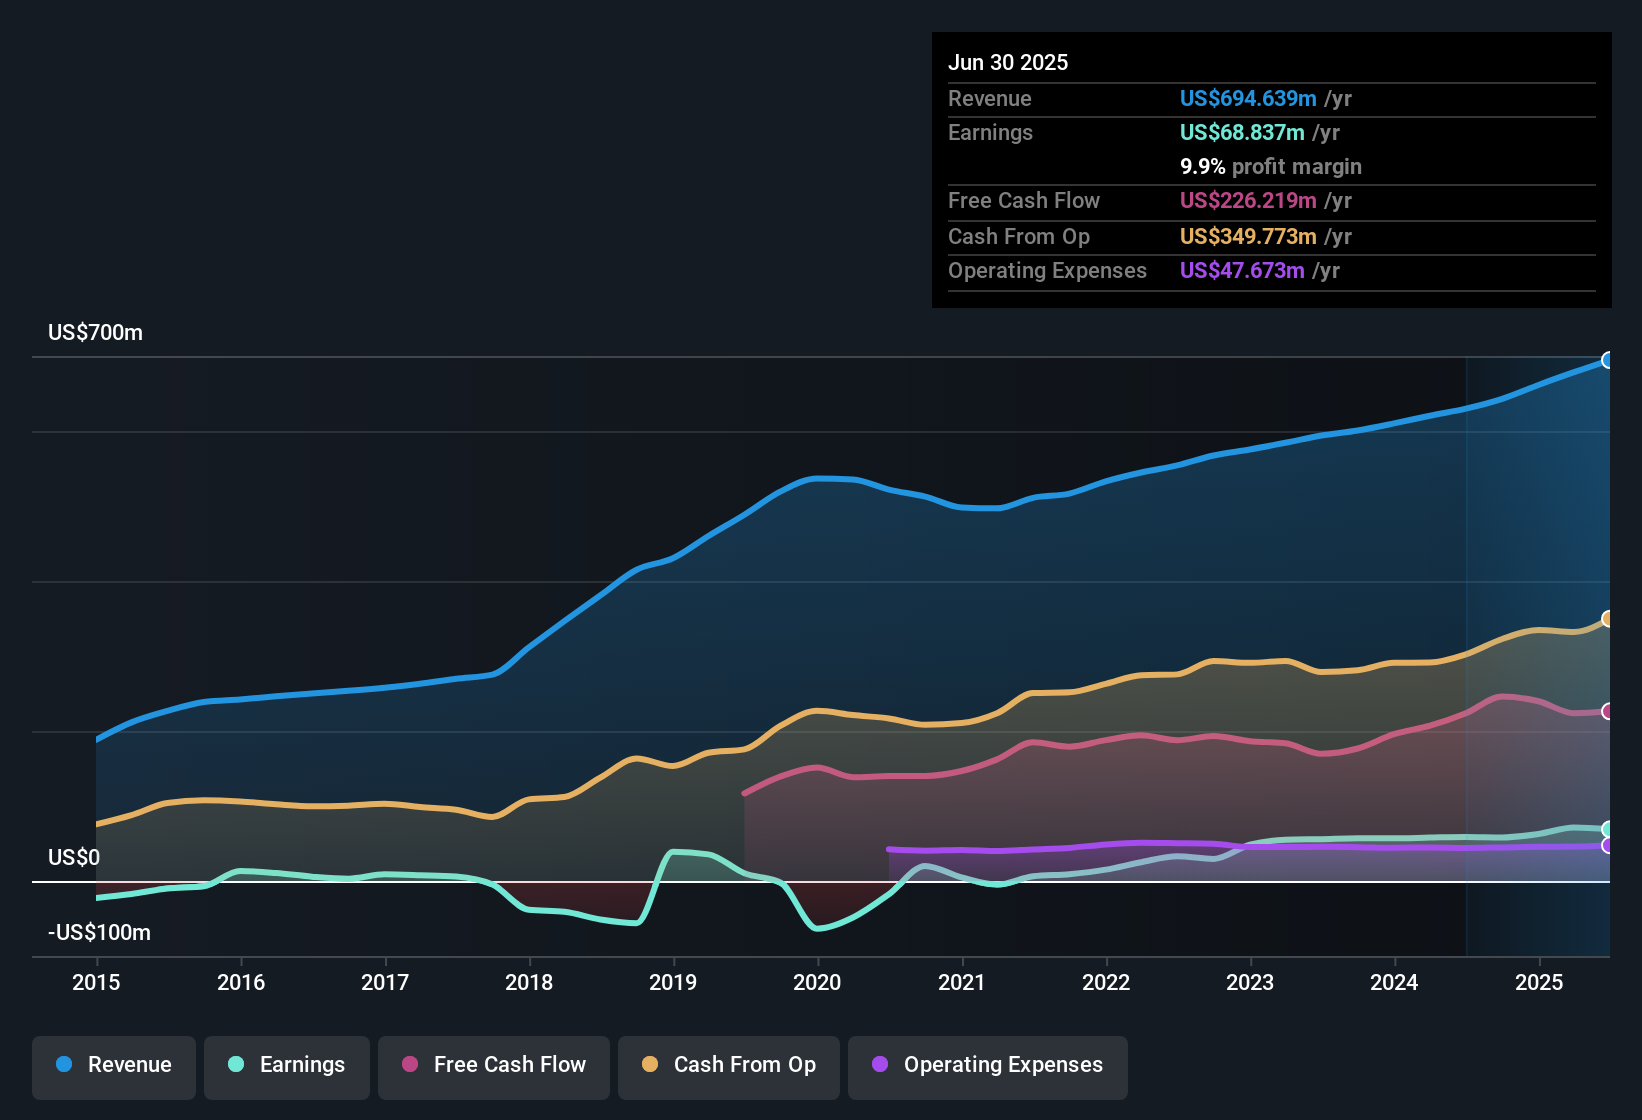
Phillips Edison (PECO) has released another set of quarterly numbers for FY 2025, reporting Q3 revenue of US$182.7 million and basic EPS of US$0.20, supported by funds from operations of US$89.3 million, which is a key metric for a retail focused REIT. The company’s revenue moved from US$161.5 million in Q2 2024 to US$182.7 million in Q3 2025. Over the same period, basic EPS ranged between US$0.09 and US$0.21, giving investors a clearer view of how cash flows and earnings have tracked alongside a net profit margin of 11.5% over the last 12 months. Overall, the results highlight a business where margins and cash generation are central to the current narrative.
See our full analysis for Phillips Edison.With the latest figures available, the next step is to see how these numbers line up with the most common narratives around Phillips Edison and where the recent performance challenges or supports those views.
FFO Holds Around US$89 Million In Q3
- For a REIT like Phillips Edison, Funds From Operations is key, and it sat at US$89.3 million in Q3 2025, very similar to Q1 2025 at US$89.0 million and above Q2 2025 at US$86.0 million. Trailing twelve month FFO reached US$348.1 million.
- Supporters with a more bullish mindset often point to this kind of steady FFO profile as a core part of the income story, yet the figures also prompt questions:
- Trailing twelve month FFO moved from US$305.7 million in the period ending Q2 2024 to US$348.1 million in the latest period, while trailing revenue moved from US$629.7 million to US$711.8 million, so cash generation and rent are moving in step.
- At the same time, the trailing net profit margin sits at 11.5%, and trailing net income of US$81.9 million is much lower than FFO, which reminds you that accounting earnings and REIT cash flow are telling different stories that bullish investors need to weigh carefully.
Trailing Net Margin Rises To 11.5%
- On a trailing twelve month basis, net income excluding extra items is US$81.9 million on US$711.8 million of revenue, which gives that 11.5% net margin compared with 9% a year earlier in the dataset.
- Investors taking a bullish angle often highlight margin improvement as a key part of their case, and the numbers add some support but also bring out a few tensions:
- Earnings growth in the dataset is described at 41.1% over the last year and 38.5% per year over five years, which lines up with the higher trailing margin. Quarterly basic EPS in 2025 has ranged between about US$0.10 and US$0.21, so the path has not been smooth from quarter to quarter.
- The dataset also mentions revenue growth of about 4.4% per year alongside that 41.1% earnings growth, which suggests earnings are moving faster than sales. Bulls may like that pattern, but it also invites closer scrutiny of cost control and interest costs.
High 57.6x P/E And Weak Interest Cover
- The stock is described as trading on a 57.6x P/E compared with a 30.4x average for US retail focused REIT peers. A DCF fair value of about US$47.59 sits above the current share price of US$37.53, and interest coverage is flagged as weak because interest payments are not well covered by earnings.
- More cautious, bearish leaning investors tend to focus on that mix of rich earnings multiple and financing risk, and the data gives them some clear talking points:
- The P/E being well above the 30.4x industry level means the market is paying a premium for each dollar of earnings, even though the same dataset identifies interest coverage as a major risk, with interest payments not well covered by earnings.
- The stock price is around 21% below the DCF fair value estimate of US$47.59. That creates a tension where the high P/E supports bearish concerns about valuation, while the DCF discount and past earnings growth push the discussion back toward potential upside if those earnings and cash flows hold up.
If you want to see how other investors are joining the dots between these numbers, the consensus style narrative for Phillips Edison is a useful next stop for context and opposing views Curious how numbers become stories that shape markets? Explore Community Narratives
Next Steps
Don't just look at this quarter; the real story is in the long-term trend. We've done an in-depth analysis on Phillips Edison's growth and its valuation to see if today's price is a bargain. Add the company to your watchlist or portfolio now so you don't miss the next big move.
See What Else Is Out There
For all the steady FFO, Phillips Edison still carries a rich 57.6x P/E, weak interest cover and a clear gap between accounting earnings and cash flow.
If you are uneasy about paying up for those earnings with financing risk on top, take a few minutes to check out 85 resilient stocks with low risk scores that prioritize sturdier financial profiles and potentially smoother sleep at night.
This article by Simply Wall St is general in nature. We provide commentary based on historical data and analyst forecasts only using an unbiased methodology and our articles are not intended to be financial advice. It does not constitute a recommendation to buy or sell any stock, and does not take account of your objectives, or your financial situation. We aim to bring you long-term focused analysis driven by fundamental data. Note that our analysis may not factor in the latest price-sensitive company announcements or qualitative material. Simply Wall St has no position in any stocks mentioned.