

Polaris (PII) Valuation Check As Recent Share Price Momentum Meets Long Term Shareholder Losses
Polaris Inc. PII | 0.00 |
Polaris (PII) has drawn investor attention after its shares closed at $67.83, with recent returns over the past month and past 3 months standing in contrast to weaker multi year performance and a current net loss.
The recent 1 month share price return of 12.97% and 7 day share price return of 6.02% suggest momentum has picked up. This comes even though the 3 year total shareholder return declined 29.47% and the 5 year total shareholder return declined 39.57%.
If Polaris has you watching the consumer durables space, it can be useful to see what else is moving by checking a curated list of 20 top founder-led companies
With Polaris shares close to the average analyst price target, recent gains and a current net loss present a puzzle: is this stock still undervalued, or is the market already pricing in any future recovery potential?
Most Popular Narrative: 1% Undervalued
Polaris' most followed narrative pegs fair value at about $68.33, which sits just above the recent close at $67.83 and closely tracks analyst pricing.
Polaris is focused on a strategic approach to mitigate the impact of tariffs through supply chain adjustments and cost control initiatives, which could potentially preserve net margins and improve earnings over time.
Want to see what is baked into that fair value? Revenue, margins and earnings are all recalibrated in detail. The profit multiple assumption may surprise you.
Result: Fair Value of $68.33 (ABOUT RIGHT)
However, you also need to weigh tariff costs, which could compress margins, and the weaker international sales that already point to pressure outside the United States.
Another View: Cash Flows Paint A Tougher Picture
While the popular narrative frames Polaris as roughly fairly priced around $68.33, the Simply Wall St DCF model tells a stricter story. On that view, the current $67.83 share price sits above an estimated future cash flow value of about $47.15, which suggests less margin for error if the upbeat assumptions do not play out.
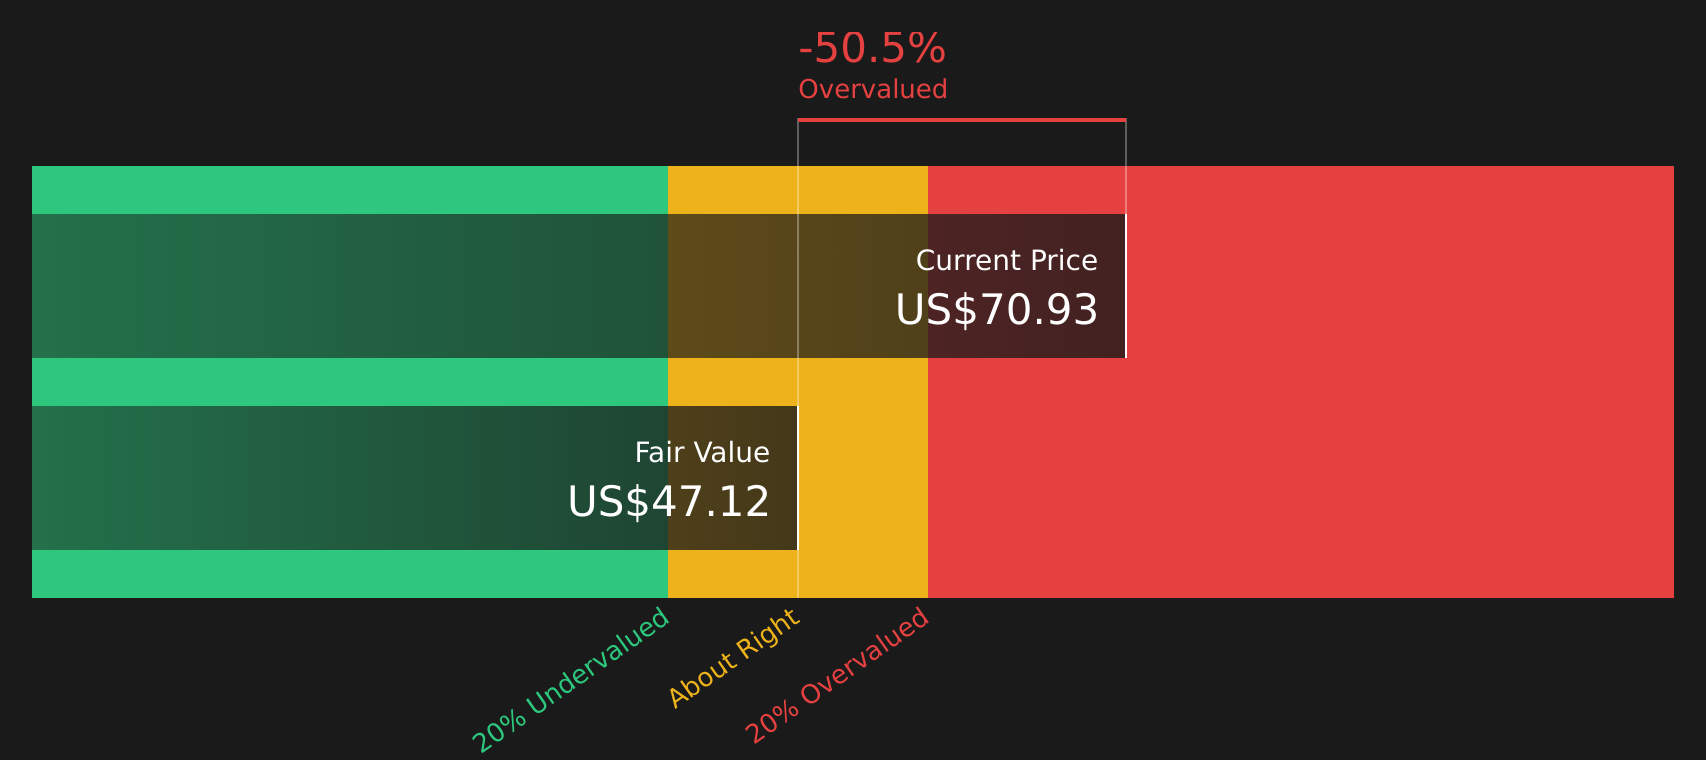
Simply Wall St performs a discounted cash flow (DCF) on every stock in the world every day (check out Polaris for example). We show the entire calculation in full. You can track the result in your watchlist or portfolio and be alerted when this changes, or use our stock screener to discover 48 high quality undervalued stocks. If you save a screener we even alert you when new companies match - so you never miss a potential opportunity.
Next Steps
With a mix of risks and rewards in the picture, the key question is how you see the balance right now. Move quickly, review the underlying data, and weigh up the 2 key rewards and 2 important warning signs.
Looking for more investment ideas?
If Polaris has sharpened your focus, do not stop here. Use the Simply Wall St Screener to uncover other stocks that fit your checklist before opportunities slip past.
- Target stronger balance sheets and steadier fundamentals with the solid balance sheet and fundamentals stocks screener (46 results).
- Hunt for quality at a sensible price by checking the 48 high quality undervalued stocks.
- Prioritize resilience and sleep a little easier at night by filtering for the 68 resilient stocks with low risk scores.
This article by Simply Wall St is general in nature. We provide commentary based on historical data and analyst forecasts only using an unbiased methodology and our articles are not intended to be financial advice. It does not constitute a recommendation to buy or sell any stock, and does not take account of your objectives, or your financial situation. We aim to bring you long-term focused analysis driven by fundamental data. Note that our analysis may not factor in the latest price-sensitive company announcements or qualitative material. Simply Wall St has no position in any stocks mentioned.