Radware (RDWR) Valuation Check After Launch Of New API Security Service
Radware Ltd. RDWR | 27.20 | +0.67% |
Radware’s New API Security Service and Why It Matters for RDWR Stock
Radware (RDWR) has launched its Radware API Security Service, an end to end offering that uses real time production traffic to help protect APIs throughout their lifecycle and address OWASP Top 10 API risks.
At a share price of $24.66, Radware has seen a 1 day share price return of 1.02% and a year to date share price return of 3.70%. Its 1 year total shareholder return of 12.04% and 3 year total shareholder return of 15.99% suggest moderate momentum over a longer horizon, despite a weaker 90 day share price return of a 5.70% decline and a 5 year total shareholder return of a 13.02% decline.
If this kind of cybersecurity product launch has your attention, it could be a good moment to scan other tech names using our high growth tech and AI stocks.
With Radware trading at $24.66 and sitting about 24% below the average analyst price target of $30.67, you have to ask yourself: is this a genuine mispricing, or is the market already factoring in future growth?
Price to Earnings of 64.3x: Is It Justified?
On a P/E of 64.3x at a last close of $24.66, Radware looks expensive compared to both its software peers and the broader US software sector.
The P/E multiple compares the current share price with earnings per share, so a higher ratio usually means investors are paying more for each dollar of profit. For a cybersecurity and application delivery business like Radware, a rich multiple can sometimes signal that the market is pricing in stronger profit growth or a higher quality earnings stream, but here the picture is mixed.
Radware has only recently moved into profitability, helped by a one off gain of $5.8m in the last twelve months. Earnings have declined by 20.6% per year over the past five years and Return on Equity sits at a low 4.3%. Against that backdrop, a 64.3x P/E suggests the market is paying a premium relative to the company’s historical earnings profile.
Compared with the US Software industry average P/E of 30.8x and a peer average of 28.8x, Radware’s 64.3x multiple is more than double those reference points. This is a wide gap for investors to weigh. See what the numbers say about this price — find out in our valuation breakdown.
Result: Price-to-Earnings of 64.3x (OVERVALUED)
However, you still have to weigh risks such as earnings pressure if the one off gain fades, and the possibility that the high P/E leaves little margin for disappointment.
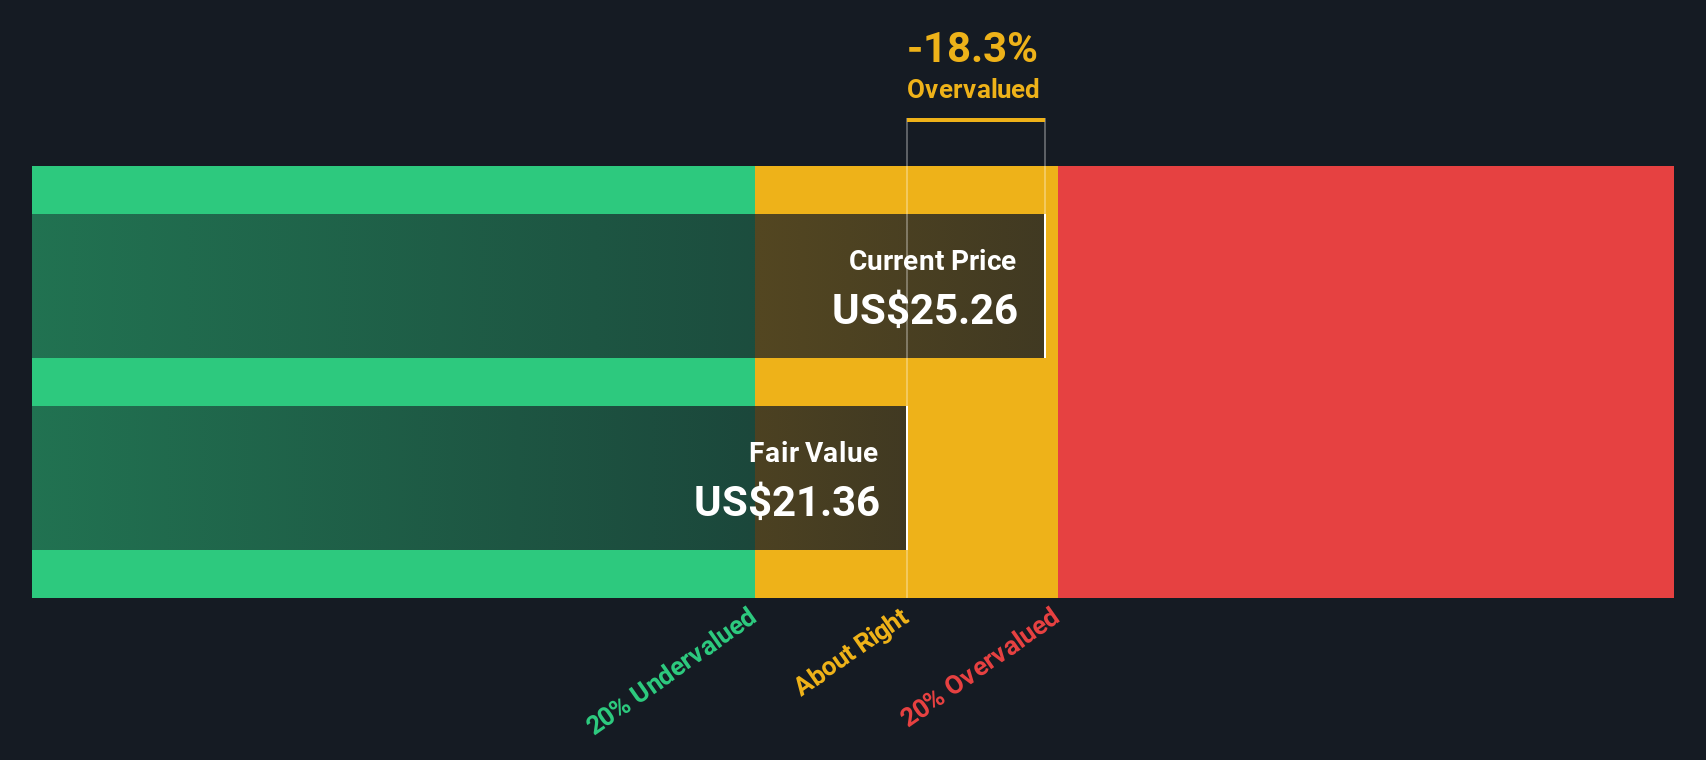
Another View: Our DCF Model Points Lower
If you set the P/E aside and look at our DCF model, the story shifts. Radware at $24.66 is trading above our future cash flow value estimate of $17.38. This suggests the shares screen as overvalued on this approach as well. So which signal do you trust more?
Simply Wall St performs a discounted cash flow (DCF) on every stock in the world every day (check out Radware for example). We show the entire calculation in full. You can track the result in your watchlist or portfolio and be alerted when this changes, or use our stock screener to discover 872 undervalued stocks based on their cash flows. If you save a screener we even alert you when new companies match - so you never miss a potential opportunity.
Build Your Own Radware Narrative
If you see the numbers differently, or prefer to test your own assumptions against the data, you can build a tailored thesis in just a few minutes, starting with Do it your way.
A great starting point for your Radware research is our analysis highlighting 2 key rewards and 2 important warning signs that could impact your investment decision.
Ready to find your next idea?
If Radware has you thinking more broadly about opportunities, do not stop here. Widen your search now or you could miss something that fits you better.
- Spot potential value pockets by checking out these 872 undervalued stocks based on cash flows that may offer more attractive prices relative to their cash flows.
- Tap into growth themes by scanning these 23 AI penny stocks that sit at the intersection of technology and artificial intelligence.
- Hunt for income ideas by reviewing these 13 dividend stocks with yields > 3% that provide yields above 3%.
This article by Simply Wall St is general in nature. We provide commentary based on historical data and analyst forecasts only using an unbiased methodology and our articles are not intended to be financial advice. It does not constitute a recommendation to buy or sell any stock, and does not take account of your objectives, or your financial situation. We aim to bring you long-term focused analysis driven by fundamental data. Note that our analysis may not factor in the latest price-sensitive company announcements or qualitative material. Simply Wall St has no position in any stocks mentioned.