RB Global (RBA) Valuation Check After Strong First Quarter Revenue And Net Income Growth
RB Global, Inc. RBA | 0.00 |
RB Global (RBA) has put fresh numbers on the table, reporting first quarter 2026 revenue of US$1,234.6 million and net income of US$135.5 million, both higher than the figures reported a year earlier.
RB Global’s recent earnings and governance updates have come against a mixed trading backdrop, with a 6.78% 1 month share price return but a 90 day share price decline of 8.42%. At the same time, the 3 year total shareholder return of 91.56% points to longer term momentum that has so far remained intact.
If these results have you looking beyond a single stock, it could be a good moment to broaden your watchlist and uncover 17 top founder-led companies
With RB Global trading at US$105.01 alongside an intrinsic value estimate that sits lower and an average analyst price target of US$125.18, you have to ask: is there still mispricing here, or is future growth already fully reflected?
Most Popular Narrative: 15.5% Undervalued
RB Global's last close at $105.01 sits well below a narrative fair value of $124.20, setting up a valuation debate built on detailed long term forecasts.
Expansion of the international buyer base and new alliance partnerships, along with ongoing growth in e-commerce marketplace activities, are expected to drive higher transaction volumes and revenue as more asset sales and auctions move online. Joint ventures and acquisitions (e.g., LKQ in the U.K., J.M. Wood in the U.S., and new operations in Australia) are building a larger global footprint and improving cross-selling opportunities, supporting long-term revenue and margin growth.
Read the complete narrative. Read the complete narrative.
Want to see what sits behind that projected step up in earnings and margins? The narrative leans on compounding revenue growth, rising profitability and a richer mix of services. Curious which assumptions really move the fair value dial here? The full breakdown lays out those drivers in plain numbers.
Result: Fair Value of $124.20 (UNDERVALUED)
However, that upside story still depends on assumptions that could be challenged by weaker transaction volumes in a softer macro environment, as well as any issues integrating recent acquisitions.
Another View: High Multiple, Higher Expectations
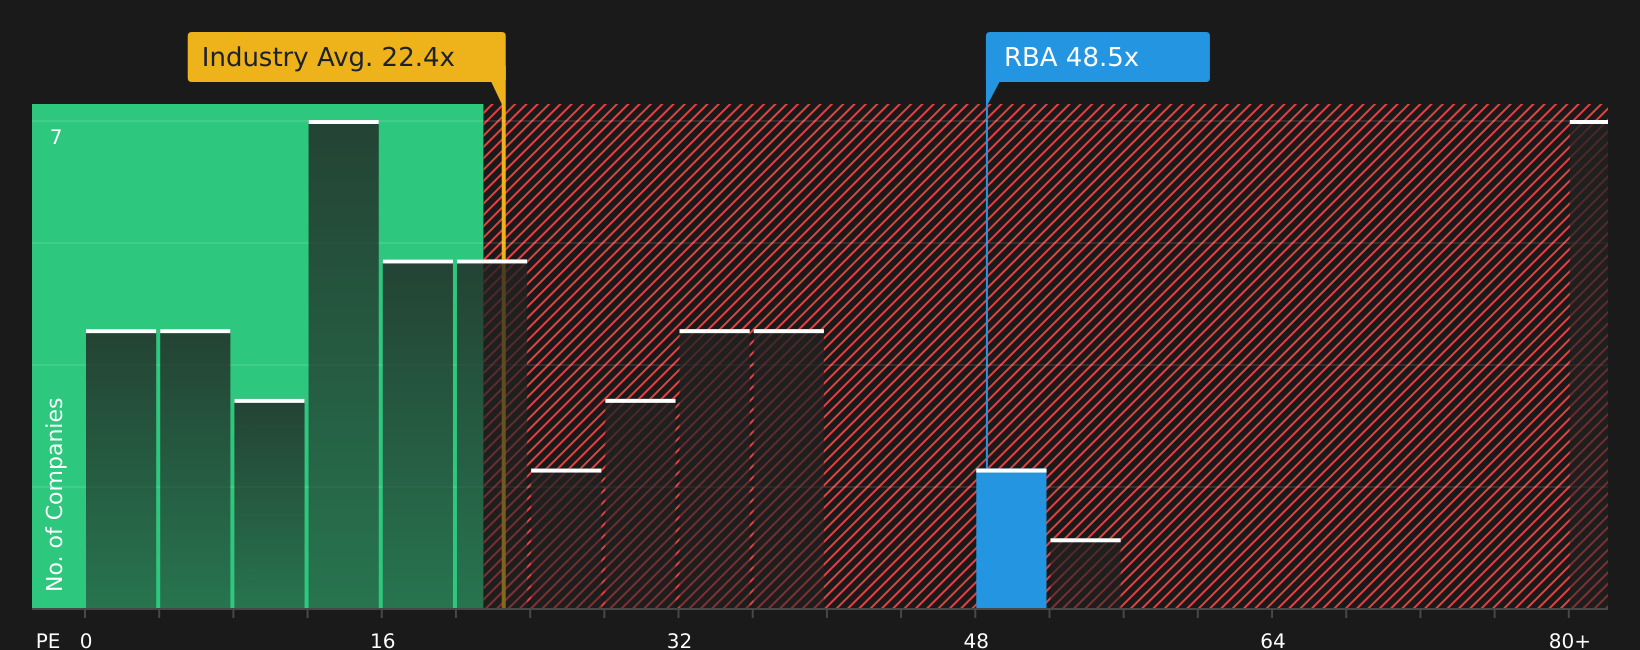
The DCF narrative points to value, but the current P/E of 51.1x sits well above both the US Commercial Services industry at 22.1x and peers at 31.4x, and also above a fair ratio of 30.6x. That gap leaves less room for error if growth or margins fall short, so which signal do you trust more?
To pressure test the price using earnings based comparisons, it helps to see how that gap to the fair ratio and peers has opened up over time, and what would need to change for it to narrow. See what the numbers say about this price — find out in our valuation breakdown.
Next Steps
After weighing up both the valuation upside story and the high expectations in the current P/E, it makes sense to look through the details yourself and move quickly if you want conviction. To see what investors are optimistic about and how those positives stack up against the risks, take a closer look at 3 key rewards
Looking for more investment ideas?
If you stop with just one stock, you might overlook opportunities that fit your style better, so use the Simply Wall St Screener to widen your field of options.
- Target dependable cash generators by scanning for companies with resilience and balance sheet strength using the solid balance sheet and fundamentals stocks screener (44 results).
- Hunt for potential value opportunities by reviewing companies that screen as 48 high quality undervalued stocks.
- Strengthen your income focus by checking out a curated list of 12 dividend fortresses.
This article by Simply Wall St is general in nature. We provide commentary based on historical data and analyst forecasts only using an unbiased methodology and our articles are not intended to be financial advice. It does not constitute a recommendation to buy or sell any stock, and does not take account of your objectives, or your financial situation. We aim to bring you long-term focused analysis driven by fundamental data. Note that our analysis may not factor in the latest price-sensitive company announcements or qualitative material. Simply Wall St has no position in any stocks mentioned.