Royal Gold (RGLD) Valuation Check After Earnings Growth Uptrend And Supportive Rate Cut Backdrop
Royal Gold, Inc. RGLD | 262.13 | -2.91% |
Royal Gold (RGLD) is back on investors’ radar after a period of accelerating revenue and earnings growth, coupled with what is described as best in class profitability and a confirmed stock uptrend.
Royal Gold’s share price has climbed to US$286.10 after a 51.8% 90 day share price return and a 93.7% 1 year total shareholder return, pointing to strong momentum as investors reassess growth prospects and perceived risk.
If this kind of run in a precious metals name has your attention, it could be worth widening your search with our 21 elite gold producer stocks sourced from the Simply Wall St screener.
With Royal Gold posting rapid revenue and earnings growth, a US$480.08m net income and a share price already near analyst targets, the key question now is whether there is still a buying opportunity here or if the market is already pricing in future growth.
Most Popular Narrative: 11.7% Undervalued
Against Royal Gold’s last close at $286.10, the most widely followed narrative pins fair value closer to $324.18, built on detailed growth and margin assumptions.
The combination with Sandstorm and Horizon portfolios will make Royal Gold more attractive to passive and generalist investors due to greater scale and diversification; this could drive a larger investor base and valuation re rating, positively impacting share price and EPS growth.
Curious what sits behind that higher fair value line? Revenue expansion, wider margins and a reset earnings multiple all play a part, but the exact mix may surprise you.
Result: Fair Value of $324.18 (UNDERVALUED)
However, this upside story could be tested if gold demand weakens or if higher debt from the Sandstorm and Horizon deals squeezes margins and dividend flexibility.
Another Angle on Valuation
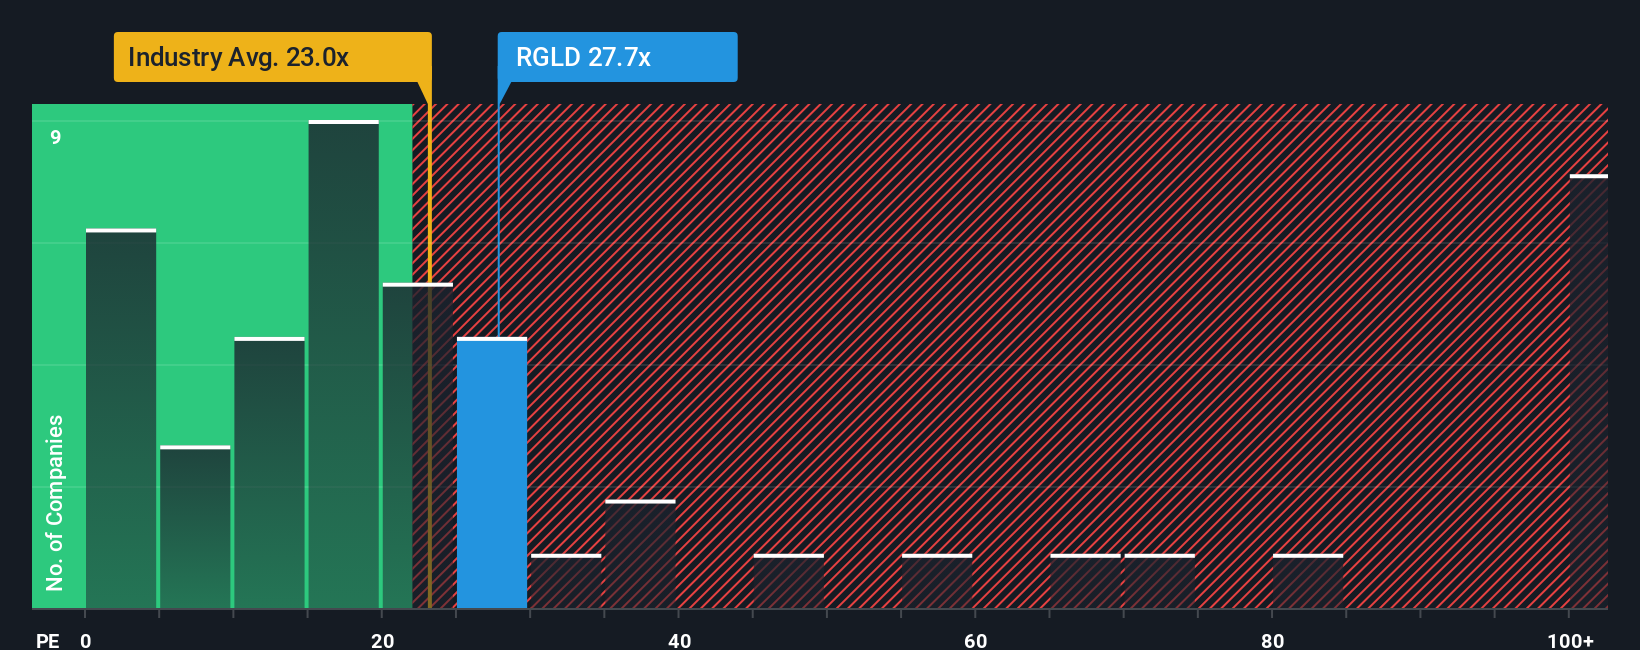
The fair value narrative points to Royal Gold trading about 11.7% below an estimated $324.18. Yet on earnings, the stock sits on a P/E of 50.3x versus 25.3x for the US Metals and Mining industry and 26.6x for peers, with a fair ratio of 53.3x suggesting the market could still shift. Is this a premium you are comfortable paying for growth and quality, or a sign to be cautious around what is already priced in?
Next Steps
If this mix of momentum, premium valuation and deal activity leaves you on the fence, it is worth looking through the numbers yourself and weighing both sides quickly. Our data already highlights 2 key rewards and 2 important warning signs so you can judge how those factors balance out for your own approach.
Looking for more investment ideas?
Before you move on, give yourself a broader watchlist by scanning other ideas on the Simply Wall St screener so you are not relying on one story alone.
- Target potential mispricing by checking out our 55 high quality undervalued stocks that pair quality fundamentals with prices that may not fully reflect them.
- Strengthen your income focus by scanning 13 dividend fortresses that aim to combine yield with business resilience.
- Reduce portfolio stress by reviewing 81 resilient stocks with low risk scores that our model flags with lower overall risk scores.
This article by Simply Wall St is general in nature. We provide commentary based on historical data and analyst forecasts only using an unbiased methodology and our articles are not intended to be financial advice. It does not constitute a recommendation to buy or sell any stock, and does not take account of your objectives, or your financial situation. We aim to bring you long-term focused analysis driven by fundamental data. Note that our analysis may not factor in the latest price-sensitive company announcements or qualitative material. Simply Wall St has no position in any stocks mentioned.