RTX (RTX) Secures $1.1 Billion Missile Contract, Is The Stock Fully Valued?
RAYTHEON TECHNOLOGIES CORPORATION RTX | 0.00 |
How the new AIM-9X contract frames RTX for investors
RTX (RTX) just saw its Raytheon defense segment secure a US$1.1b U.S. Navy contract for AIM-9X Block II missiles, with production capacity rising to 2,500 units a year to meet higher demand.
For you as an investor, this contract shows how RTX is connected to ongoing orders for advanced missile systems from both U.S. and allied customers, and it also reflects a commitment to additional engineering and manufacturing work in Tucson, Arizona.
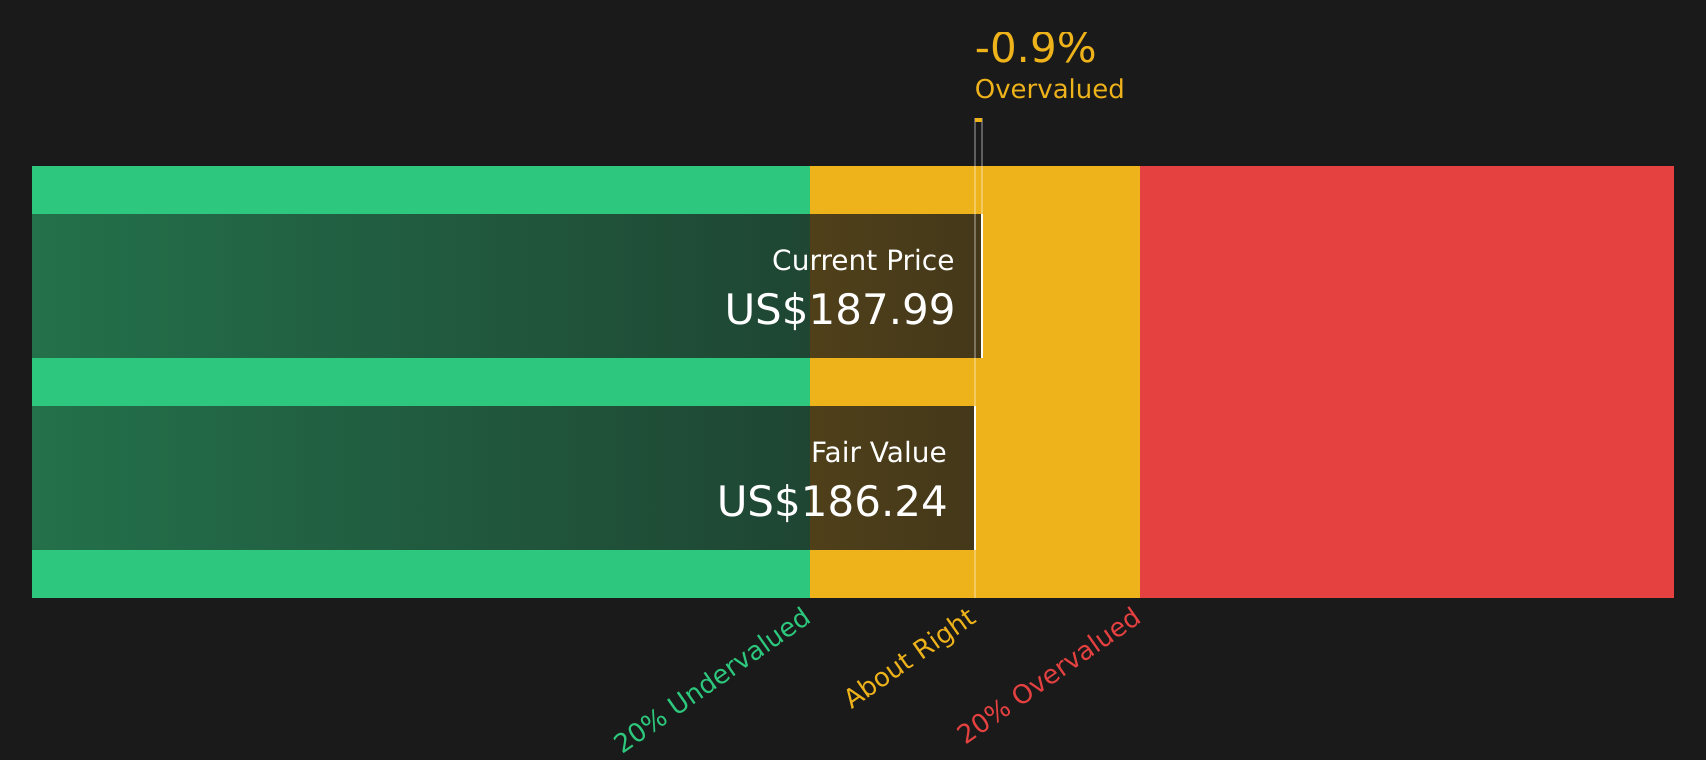
RTX shares are trading at US$187.99 after a 6.46% 30 day share price return, while the 1 year total shareholder return of 32.02% and 5 year total shareholder return of 142.05% point to momentum that has built over time.
If RTX’s defense contracts have you thinking about where else capital is flowing, it could be worth scanning for other opportunities using the 35 power grid technology and infrastructure stocks
RTX now trades at US$187.99 with a value score of 3 and a small 0.96% premium to one intrinsic estimate, while sitting about 14.75% below the average analyst target. This raises the question of whether there is still a buying opportunity here or if the market is already pricing in future growth.
Price-to-earnings of 34.9x for RTX: Is it justified?
RTX is trading on a P/E of 34.9x, which sits below both its Aerospace & Defense peers and the broader industry, even after the recent share price strength.
The P/E multiple compares RTX's current share price to its earnings per share, so it is effectively the price investors are paying for each dollar of current earnings. For an established aerospace and defense group with US$90.4b in revenue and US$7.3b in net income, this metric is a common way investors frame expectations around future earnings and contract visibility.
RTX is flagged as trading at "good value compared to peers and industry," with its 34.9x P/E below the US Aerospace & Defense industry average of 38.9x and the peer average of 55x. The valuation also lines up closely with an estimated fair P/E of 35.5x, which indicates that the current multiple is close to a level the market might consider consistent with similar expectations.
Result: Price-to-earnings of 34.9x (ABOUT RIGHT)
However, RTX still faces risks, including reliance on U.S. defense budgets and the need for successful execution across complex segments like Pratt & Whitney and Collins Aerospace.
Another View on RTX using the SWS DCF model
Alongside the P/E check, the SWS DCF model prices RTX at $186.21 per share, slightly below the current $187.99. That points to the stock trading at a small premium on cash flow assumptions, which sits awkwardly next to the "good value" P/E story.
This kind of gap is small in dollar terms but important in what it implies. It suggests earnings-based comparisons and long-term cash flow estimates are not fully aligned. Investors may therefore need to consider which lens they trust more when sizing a position or setting entry levels.
Simply Wall St performs a discounted cash flow (DCF) on every stock in the world every day (check out RTX for example). We show the entire calculation in full. You can track the result in your watchlist or portfolio and be alerted when this changes, or use our stock screener to discover 44 high quality undervalued stocks. If you save a screener we even alert you when new companies match - so you never miss a potential opportunity.
Next Steps
If this RTX snapshot feels mixed, that is the point. The stock carries both concerns and optimism, so move quickly to review the full picture via the 4 key rewards and 2 important warning signs
Looking for more RTX style investment ideas?
If RTX has sharpened your appetite for finding well researched stocks, do not stop here. Use focused stock lists so you are not leaving opportunities on the table.
- Target potential mispricings by scanning companies that combine quality fundamentals with attractive valuations through the 44 high quality undervalued stocks.
- Strengthen your income stream by reviewing shares with robust payouts and higher yields using the 8 dividend fortresses.
- Dial down portfolio risk by filtering for companies with resilient finances and lower risk scores via the 71 resilient stocks with low risk scores.
This article by Simply Wall St is general in nature. We provide commentary based on historical data and analyst forecasts only using an unbiased methodology and our articles are not intended to be financial advice. It does not constitute a recommendation to buy or sell any stock, and does not take account of your objectives, or your financial situation. We aim to bring you long-term focused analysis driven by fundamental data. Note that our analysis may not factor in the latest price-sensitive company announcements or qualitative material. Simply Wall St has no position in any stocks mentioned.