Safety Insurance Group (SAFT) Doubles Credit Facility, Is The Stock Already Expensive?
Safety Insurance Group, Inc. SAFT | 0.00 |
Safety Insurance Group (SAFT) recently amended its revolving credit agreement, doubling the committed facility from $50 million to $100 million and extending the maturity to June 2031. This provides investors with updated information on the company’s available liquidity.
The revolving credit amendment arrives after a stronger short term run in Safety Insurance Group’s stock, with a 1 month share price return of 7.18% and a 1 year total shareholder return of 0.27% alongside a 3 year total shareholder return of 20.74%.
If this kind of insurer focused move has your attention, it may be a good moment to broaden your watchlist and check out 20 top founder-led companies
With Safety Insurance Group shares up 7.18% over the past month but only 0.27% over the past year, and trading at an estimated 18% premium to one intrinsic value estimate, you have to ask: is there still a buying opportunity here, or is the market already pricing in future growth?
Price to earnings of 17.4x: Is it justified?
Safety Insurance Group is currently trading on a P/E of 17.4x, with a last close price of $75.21 and industry and peer averages that are lower.
The P/E ratio compares the company’s share price with its earnings per share and is a common way investors assess how much they are paying for each dollar of profit. For an insurer like Safety Insurance Group, the P/E often reflects expectations around underwriting discipline, investment income and the stability of earnings over time.
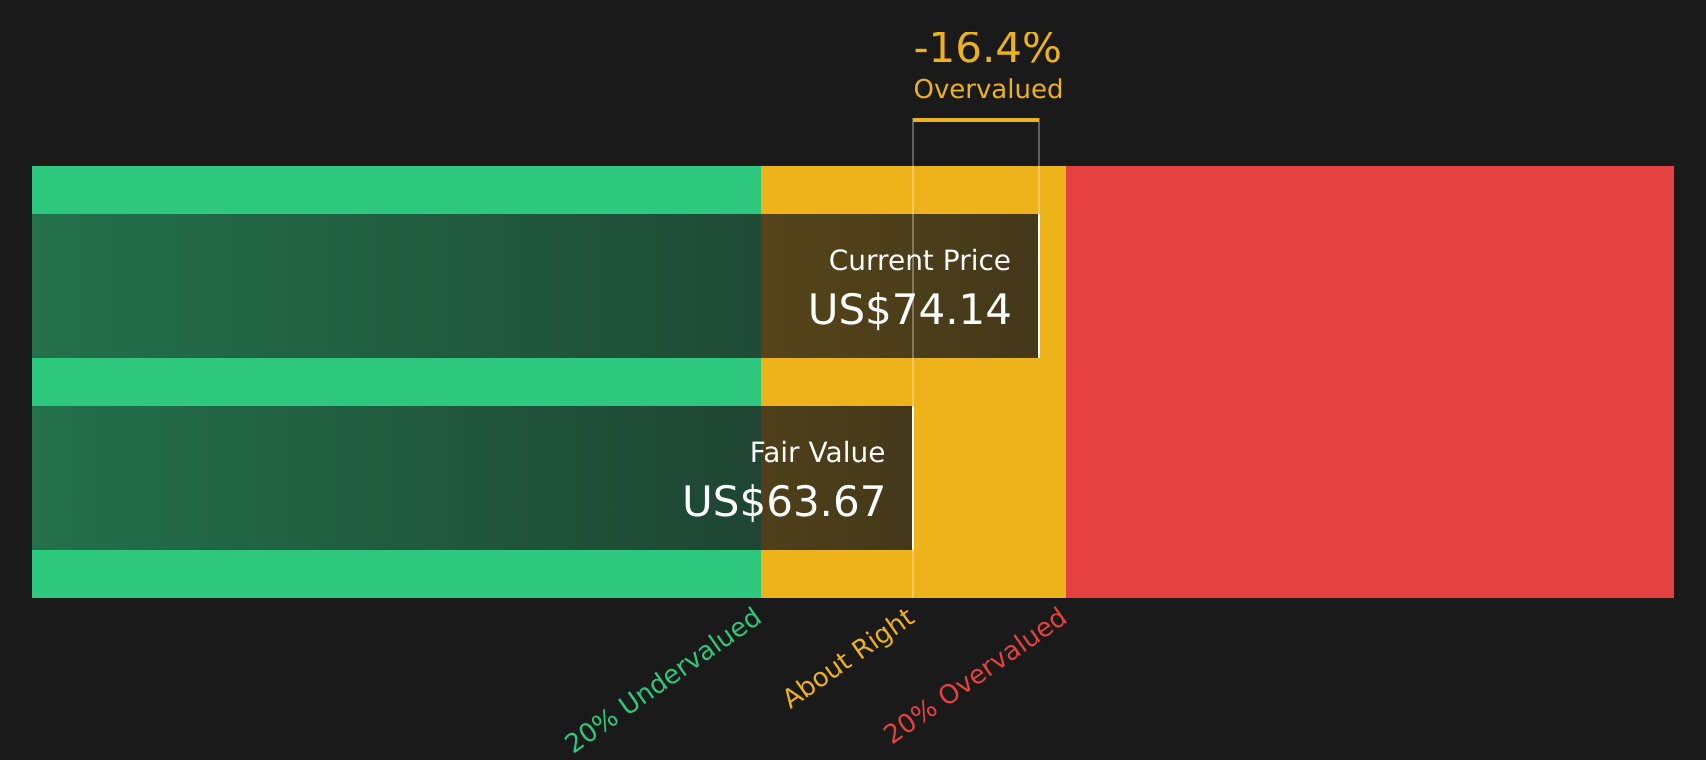
Here, the picture is mixed. The stock trades below the broader US market P/E of 19.1x, yet it is described as expensive versus the US Insurance industry average of 11.8x and slightly expensive versus a peer average of 17.1x. Coupled with the SWS DCF estimate of future cash flow value at $63.67 per share versus the current $75.21 price, the valuation suggests investors are paying a premium compared with both cash flow estimates and sector benchmarks.
Against that backdrop, the SWS DCF model, which projects future cash flows and discounts them back to today, indicates Safety Insurance Group is trading above one intrinsic value estimate. At the same time, the P/E sits between market and industry levels, encouraging investors to think carefully about what kind of earnings profile is being priced in by the market.
Result: Price-to-earnings of 17.4x (OVERVALUED)
However, Safety Insurance Group’s concentration in Massachusetts and its current 18% premium to one intrinsic value estimate could leave the stock vulnerable if sentiment or underwriting conditions weaken.
Another view on Safety Insurance Group's value
While the P/E comparison paints Safety Insurance Group as relatively expensive versus the US Insurance industry, the SWS DCF model offers another angle. On that measure, the stock trades at about an 18% premium to an estimated future cash flow value of $63.67 per share. For you as an investor, that kind of gap raises a simple question: how comfortable are you paying above this modeled value for an insurer with recent earnings pressure?
Simply Wall St performs a discounted cash flow (DCF) on every stock in the world every day (check out Safety Insurance Group for example). We show the entire calculation in full. You can track the result in your watchlist or portfolio and be alerted when this changes, or use our stock screener to discover 44 high quality undervalued stocks. If you save a screener we even alert you when new companies match - so you never miss a potential opportunity.
Next Steps
With mixed signals around Safety Insurance Group’s valuation and risk profile, now is a good time to review the underlying data yourself and move promptly. To balance those concerns and potential upsides in one place, take a look at the 2 key rewards and 1 important warning sign
Looking for more investment ideas beyond Safety Insurance Group?
If Safety Insurance Group has sharpened your focus, do not stop here. Broaden your opportunity set and pressure test your thesis against other stocks and sectors.
- Target resilient income by scanning companies that pay substantial yields and aim for durability through the 8 dividend fortresses.
- Hunt for mispriced quality by filtering for stocks that combine solid fundamentals with attractive valuations using the 44 high quality undervalued stocks.
- Prioritise capital preservation by focusing on companies with steadier profiles and lower risk scores through the 71 resilient stocks with low risk scores.
This article by Simply Wall St is general in nature. We provide commentary based on historical data and analyst forecasts only using an unbiased methodology and our articles are not intended to be financial advice. It does not constitute a recommendation to buy or sell any stock, and does not take account of your objectives, or your financial situation. We aim to bring you long-term focused analysis driven by fundamental data. Note that our analysis may not factor in the latest price-sensitive company announcements or qualitative material. Simply Wall St has no position in any stocks mentioned.