Seaboard (SEB) Margin Rebound Challenges Long Running Bearish Earnings Narrative
Seaboard Corporation SEB | 5906.78 | +2.53% |
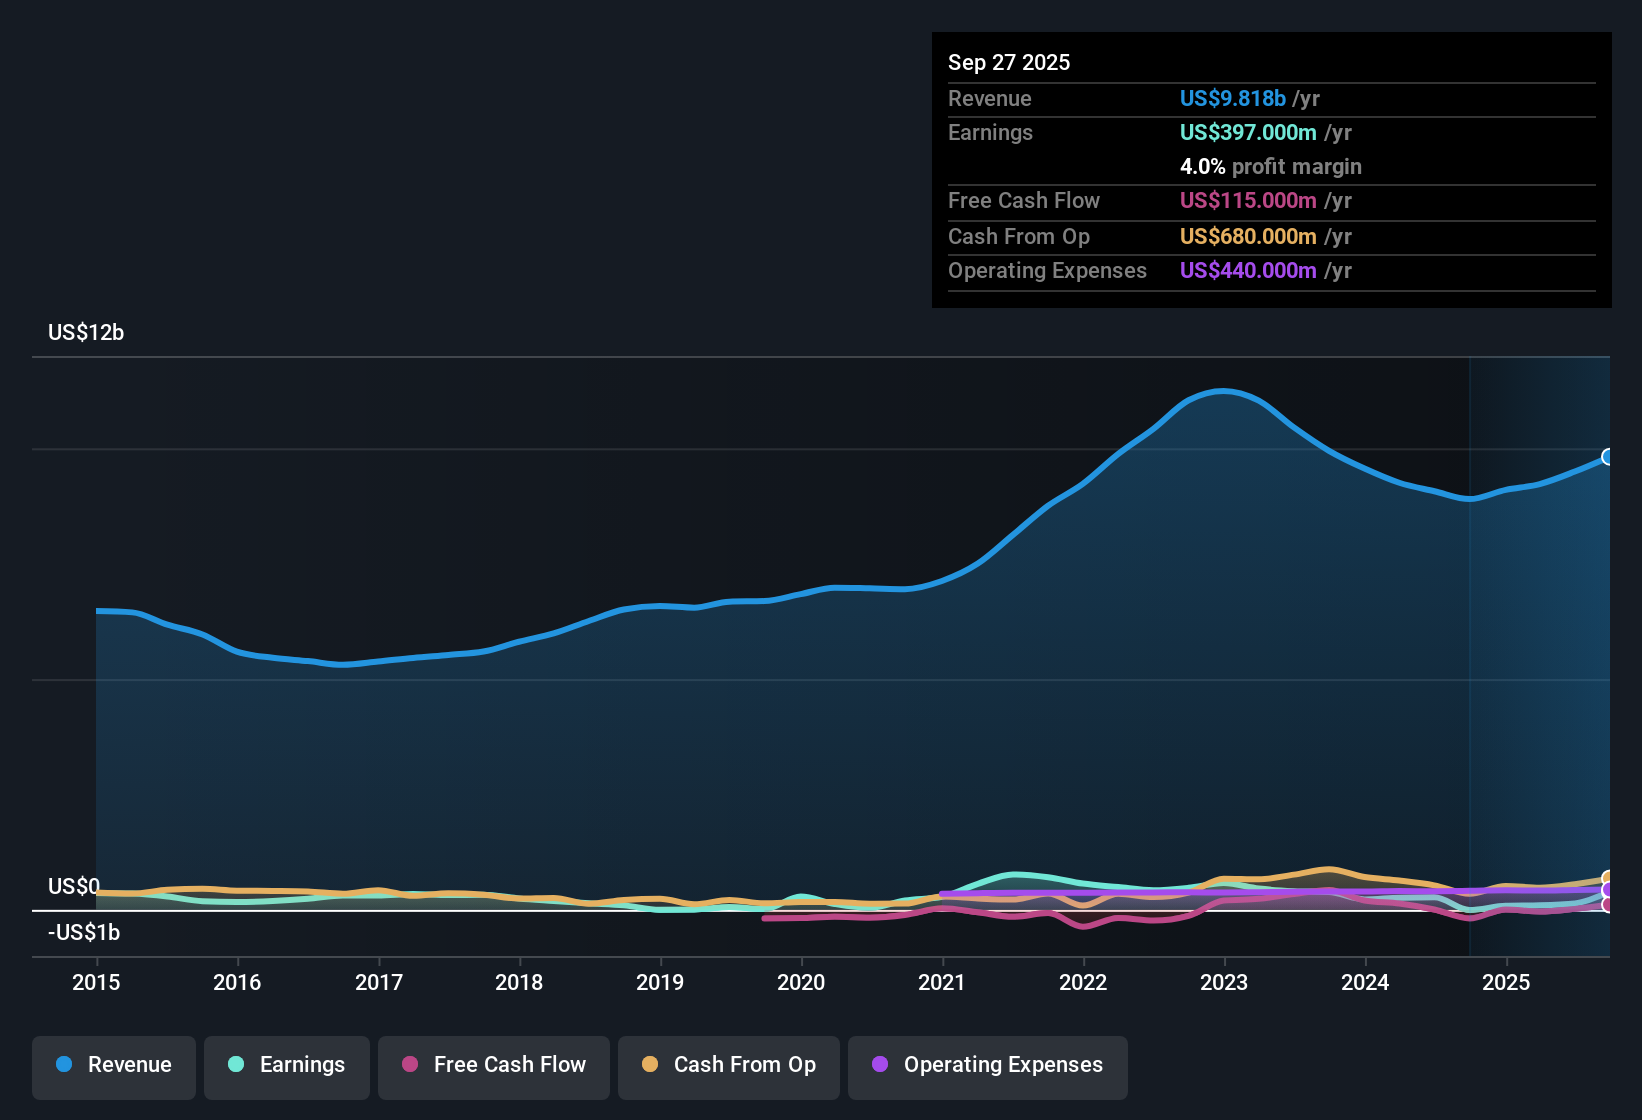
Seaboard (SEB) has just wrapped up FY 2025 with Q4 revenue of US$2.4 billion and basic EPS of US$264.23, while trailing twelve month revenue sits at US$9.7 billion with EPS of US$514.46, against a backdrop of very large year over year earnings growth and a trailing net margin of 5.1% compared with 1% a year earlier. Over recent periods, the company has seen quarterly revenue range from US$2.3 billion to US$2.5 billion in FY 2025, with basic EPS moving from US$32.95 in Q1 to US$264.23 in Q4. Trailing twelve month EPS has moved from US$90.62 at the end of 2024 to US$514.46 at the end of 2025, setting up a results story that puts improving profitability and margins at the center of how investors are likely to read this update.
See our full analysis for Seaboard.With the headline numbers on the table, the next step is to see how this earnings profile lines up with the widely held narratives around Seaboard’s profit trajectory and recovery, and where those stories may need updating.
5.1% margin versus 1% last year
- Over the last 12 months, Seaboard earned US$496 million of net income on US$9.7b of revenue, giving a 5.1% net margin compared with 1% a year earlier based on the trailing data.
- What stands out for a bullish view is that this margin picture now lines up with a very large year over year earnings improvement, as the trailing figures show net income moving from US$88 million to US$496 million and EPS moving from US$90.62 to US$514.46, which is a very different backdrop to the multi year pattern of earnings declining 21.7% each year on average.
Investors who want to see how this ties into a broader story around growth, risks and valuation can check the fuller narrative on Seaboard here: 📊 Read the full Seaboard Consensus Narrative.
Earnings swing versus five year trend
- The five year record shows earnings declining at an annualized 21.7%, yet over the most recent year the same dataset records a very large 463.6% earnings increase, with trailing EPS moving from US$90.62 to US$514.46.
- Critics highlight the multi year decline as a key risk, and this view is only partly answered by the last 12 months, as quarterly EPS in FY 2025 ranged widely from US$32.95 in Q1 to US$264.23 in Q4 while net income moved from US$32 million to US$253 million, so anyone leaning bearish can still point to how volatile that earnings path looks even alongside the recent improvement.
P/E of 10.4x versus higher peers
- Seaboard is trading on a trailing P/E of 10.4x, which the data shows is below the US market at 19.2x, below the peer average at 17.6x and also below the US Food industry at 24.1x, even as trailing EPS stands at US$514.46.
- What is interesting for investors weighing valuation is that the same dataset also flags the current share price of US$5,373.93 as materially higher than a DCF fair value of US$39.96. Anyone arguing the stock looks inexpensive on P/E has to reconcile that with a model based view that prices in much lower future cash flows relative to today's market value.
Next Steps
Don't just look at this quarter; the real story is in the long-term trend. We've done an in-depth analysis on Seaboard's growth and its valuation to see if today's price is a bargain. Add the company to your watchlist or portfolio now so you don't miss the next big move.
See What Else Is Out There
For all the recent earnings strength, Seaboard still carries a long record of earnings decline, volatile quarterly EPS and a share price far above its DCF fair value estimate.
If that mix of volatility and a rich current price makes you cautious, you might want to look at 54 high quality undervalued stocks that pair stronger value signals with more grounded pricing.
This article by Simply Wall St is general in nature. We provide commentary based on historical data and analyst forecasts only using an unbiased methodology and our articles are not intended to be financial advice. It does not constitute a recommendation to buy or sell any stock, and does not take account of your objectives, or your financial situation. We aim to bring you long-term focused analysis driven by fundamental data. Note that our analysis may not factor in the latest price-sensitive company announcements or qualitative material. Simply Wall St has no position in any stocks mentioned.