

Should Stronger Q2 2026 Earnings and Profitability Trends at Cheniere (CQP) Require Action From Investors?
Cheniere Energy Partners, L.P. CQP | 0.00 |
- In August 2026, Cheniere Energy Partners, L.P. reported past second-quarter 2026 results showing revenue of US$2,583 million and net income of US$1,161 million, with basic earnings per share from continuing operations of US$2.14, all higher than the same period a year earlier.
- For the first half of 2026, the partnership’s revenue rose to US$6,183 million and net income to US$1,347 million, indicating stronger profitability and higher earnings per unit compared with the prior-year period.
- With this improvement in earnings per share and overall profitability, we’ll examine how the results shape Cheniere Energy Partners’ investment narrative.
Uncover the next big thing with 20 elite penny stocks that balance risk and reward.
What Is Cheniere Energy Partners' Investment Narrative?
To own Cheniere Energy Partners, you need to be comfortable with a capital‑intensive LNG business whose appeal rests on contracted cash flows, relatively low valuation multiples and an income-oriented distribution policy. The latest second‑quarter 2026 results, with higher revenue and a sharp rebound in net income and earnings per unit versus last year, reinforce the near‑term earnings story rather than change it. They support the idea that recent debt issuance is being underpinned by strong cash generation, which matters for servicing obligations and sustaining distributions in the short run. At the same time, the core risks flagged before this update remain: high leverage, an uneven earnings profile across quarters and forecasts that point to softer profit trends ahead. The new numbers improve sentiment, but they do not erase balance sheet and earnings‑trajectory questions.
However, investors still need to watch how that high debt load interacts with future cash flows. Cheniere Energy Partners' shares are on the way up, but could they be overextended? Uncover how much higher they are than fair value.Exploring Other Perspectives
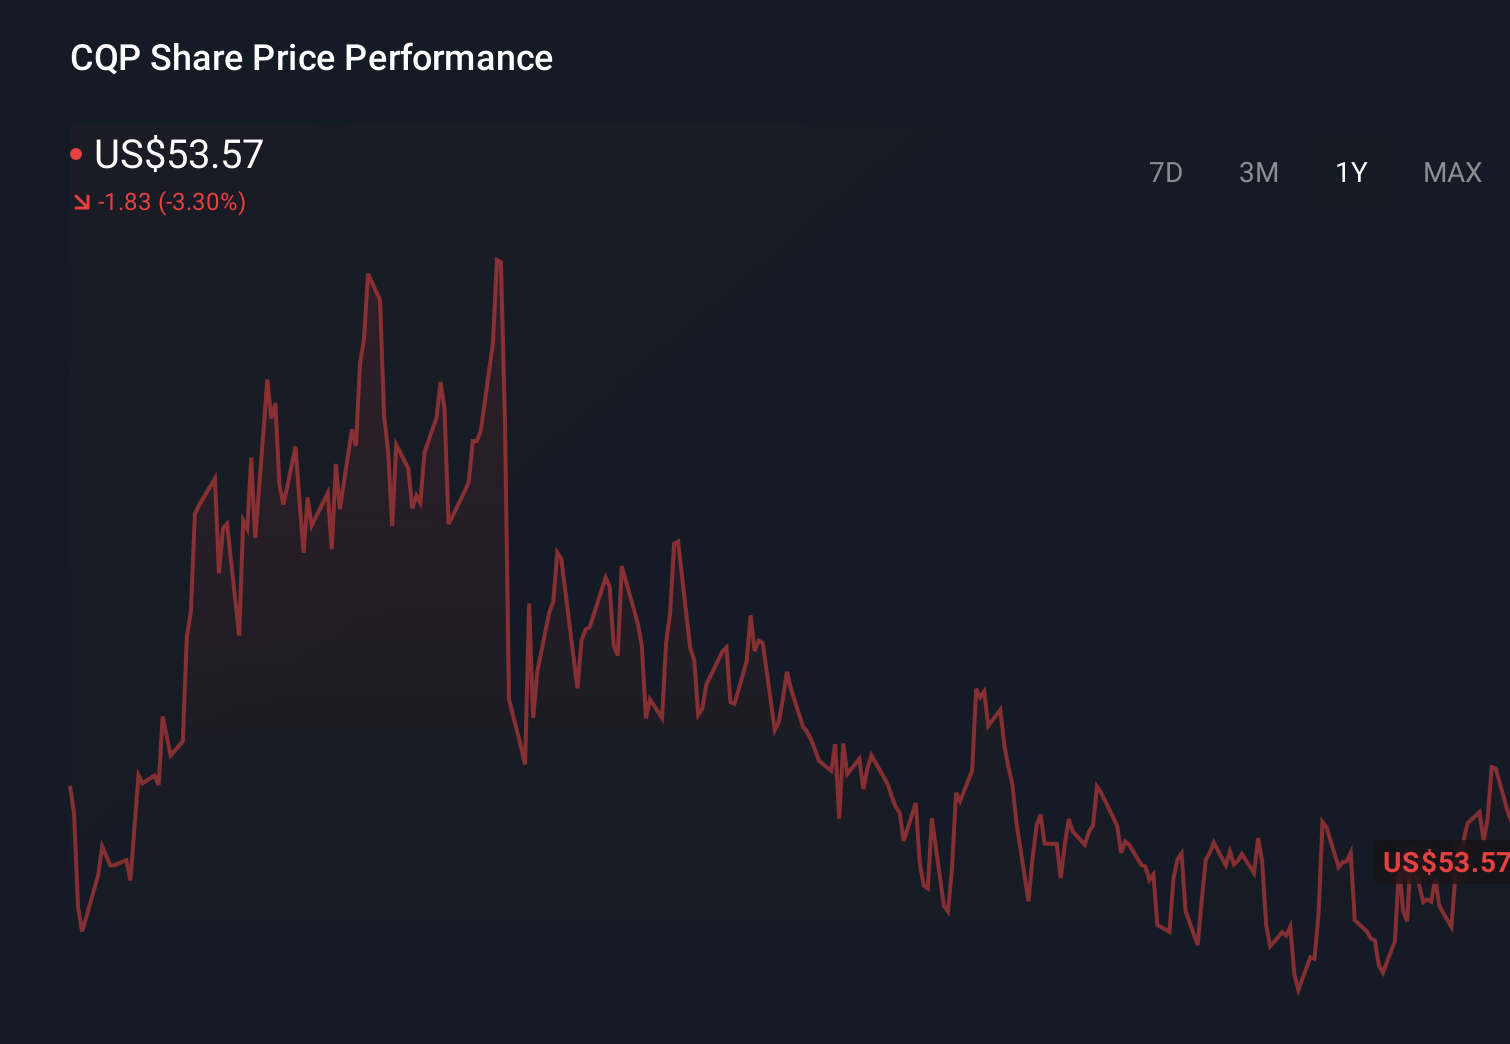
Explore 2 other fair value estimates on Cheniere Energy Partners - why the stock might be worth less than half the current price!
Reach Your Own Conclusion
Disagree with this assessment? Extraordinary investment returns rarely come from following the herd, so go with your instincts.
- A great starting point for your Cheniere Energy Partners research is our analysis highlighting 3 key rewards and 3 important warning signs that could impact your investment decision.
- Our free Cheniere Energy Partners research report provides a comprehensive fundamental analysis summarized in a single visual - the Snowflake - making it easy to evaluate Cheniere Energy Partners' overall financial health at a glance.
Looking For Alternative Opportunities?
These stocks are moving-our analysis flagged them today. Act fast before the price catches up:
- The future of work is here. Discover the 37 top robotics and automation stocks leading the charge in AI-driven automation and industrial transformation.
- Find 53 companies with promising cash flow potential yet trading below their fair value.
- The latest GPUs need a type of rare earth metal called Dysprosium and there are only 28 companies in the world exploring or producing it. Find the list for free.
This article by Simply Wall St is general in nature. We provide commentary based on historical data and analyst forecasts only using an unbiased methodology and our articles are not intended to be financial advice. It does not constitute a recommendation to buy or sell any stock, and does not take account of your objectives, or your financial situation. We aim to bring you long-term focused analysis driven by fundamental data. Note that our analysis may not factor in the latest price-sensitive company announcements or qualitative material. Simply Wall St has no position in any stocks mentioned.