

Should Teledyne’s Record Orders, Higher Guidance and ESOP Shelf Offering Require Action From Teledyne Technologies (TDY) Investors?
Teledyne Technologies Incorporated TDY | 0.00 |
- Earlier this week, Teledyne Technologies reported Q2 2026 results showing sales of US$1,662.5 million and net income of US$251.7 million, alongside filing a US$651.22 million shelf registration to offer 1,000,000 common shares for an ESOP-related program.
- The combination of record quarterly orders, higher full-year guidance, and a new employee stock ownership plan offering highlights Teledyne’s focus on both growth and long-term workforce alignment.
- We’ll now examine how Teledyne’s record orders and upgraded full-year outlook influence the company’s existing investment narrative and assumptions.
Uncover the next big thing with 21 elite penny stocks that balance risk and reward.
Teledyne Technologies Investment Narrative Recap
To own Teledyne, you generally need to be comfortable with a diversified, higher quality imaging and sensing business where defense, aerospace and marine demand are key drivers, while accepting integration and margin execution risk. The latest record Q2 orders, raised full year guidance and ESOP related shelf registration reinforce the near term catalyst around strong defense and unmanned systems orders. They do not, however, remove the underlying risk that integration challenges in acquired businesses could pressure margins if progress slows.
Among recent announcements, the Q2 2026 earnings release is most relevant, as it ties directly to the upgraded full year outlook and record orders that underpin the current thesis around long cycle defense and space imaging demand. Sales of US$1,662.5 million and net income of US$251.7 million, alongside higher EPS guidance, give investors more recent data to judge whether operating leverage and integration efforts are translating into better earnings quality, or if margin pressure remains a concern beneath the headline growth.
Yet even with strong orders and higher guidance, investors should be aware that ongoing integration related margin pressure in acquired businesses could...
Teledyne Technologies’ narrative projects $7.2 billion revenue and $1.1 billion earnings by 2029.
Uncover how Teledyne Technologies' forecasts yield a $736.85 fair value, a 12% upside to its current price.
Exploring Other Perspectives
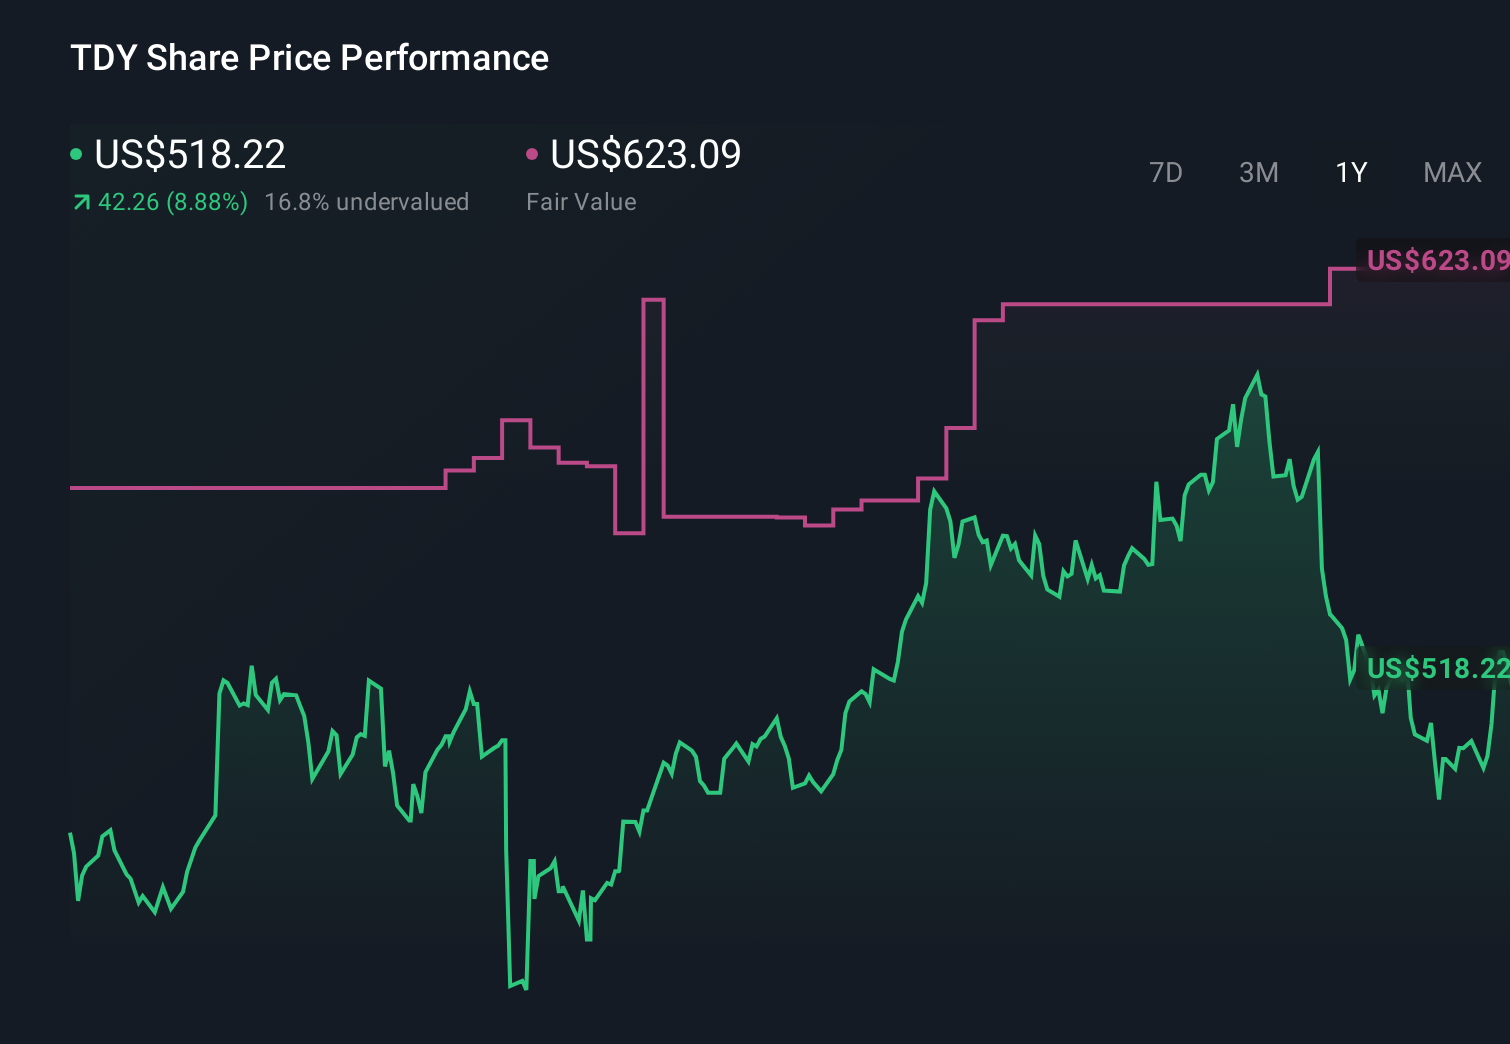
Two fair value estimates from the Simply Wall St Community span roughly US$610 to US$737 per share, underscoring how far individual views can stretch. Against this, some investors will weigh the recent record orders catalyst alongside ongoing integration and margin risks, and may want to explore several different perspectives before forming a view on Teledyne’s performance potential.
Explore 2 other fair value estimates on Teledyne Technologies - why the stock might be worth 7% less than the current price!
The Verdict Is Yours
Disagree with existing narratives? Extraordinary investment returns rarely come from following the herd, so go with your instincts.
- A great starting point for your Teledyne Technologies research is our analysis highlighting 2 key rewards that could impact your investment decision.
- Our free Teledyne Technologies research report provides a comprehensive fundamental analysis summarized in a single visual - the Snowflake - making it easy to evaluate Teledyne Technologies' overall financial health at a glance.
No Opportunity In Teledyne Technologies?
Early movers are already taking notice. See the stocks they're targeting before they've flown the coop:
- Invest in the nuclear renaissance through our list of 90 elite nuclear energy infrastructure plays powering the global AI revolution.
- We've uncovered the 9 dividend fortresses yielding 5%+ that don't just survive market storms, but thrive in them.
- The latest GPUs need a type of rare earth metal called Dysprosium and there are only 29 companies in the world exploring or producing it. Find the list for free.
This article by Simply Wall St is general in nature. We provide commentary based on historical data and analyst forecasts only using an unbiased methodology and our articles are not intended to be financial advice. It does not constitute a recommendation to buy or sell any stock, and does not take account of your objectives, or your financial situation. We aim to bring you long-term focused analysis driven by fundamental data. Note that our analysis may not factor in the latest price-sensitive company announcements or qualitative material. Simply Wall St has no position in any stocks mentioned.