SM Energy (SM) Stock Valuation Check After Geopolitical Jitters And Sector Volatility
SM Energy Company SM | 0.00 |
SM Energy (SM) stock has been moving sharply as US-Iran tensions, reports of possible peace talks, and US military activity near Oman ripple through energy equities, setting up a sector-driven move rather than company-specific news.
Recent swings around US Iran headlines sit against a much stronger backdrop, with SM Energy’s share price return up 16.27% over 90 days and 62.83% year to date, while the 1 year total shareholder return is 15.04% and the 5 year total shareholder return is 63.87%. This suggests momentum that has been building rather than fading, despite short term sector driven pullbacks.
If geopolitical moves in energy have your attention, it can be useful to see what else is moving across the sector and related plays using the 35 power grid technology and infrastructure stocks
So with SM Energy trading around $31.15, recent gains, reported growth in revenue and net income, and a discount to analyst targets and some intrinsic estimates, is this a case of mispricing or a market already accounting for potential future growth?
Most Popular Narrative: 8.1% Overvalued
Compared with the latest fair value estimate of $28.82, SM Energy’s last close at $31.15 sits above the narrative’s mark, raising questions about what needs to go right for that valuation to catch up.
The analysts have a consensus price target of $40.0 for SM Energy based on their expectations of its future earnings growth, profit margins and other risk factors. However, there is a degree of disagreement amongst analysts, with the most bullish reporting a price target of $59.0, and the most bearish reporting a price target of just $27.0.
Curious how a stock can be labelled overvalued even when forecasts call for double digit revenue and earnings growth, richer margins, and a higher future earnings multiple? The narrative hinges on a tight mix of growth expectations, profit compression, and a valuation reset that does not fully line up with those current analyst targets.
Result: Fair Value of $28.82 (OVERVALUED)
However, that setup still leans on smooth execution in Uinta and steady capital needs, and any operational hiccups or heavier spending could quickly challenge the current overvaluation story.
Another View: DCF Paints a Very Different Picture
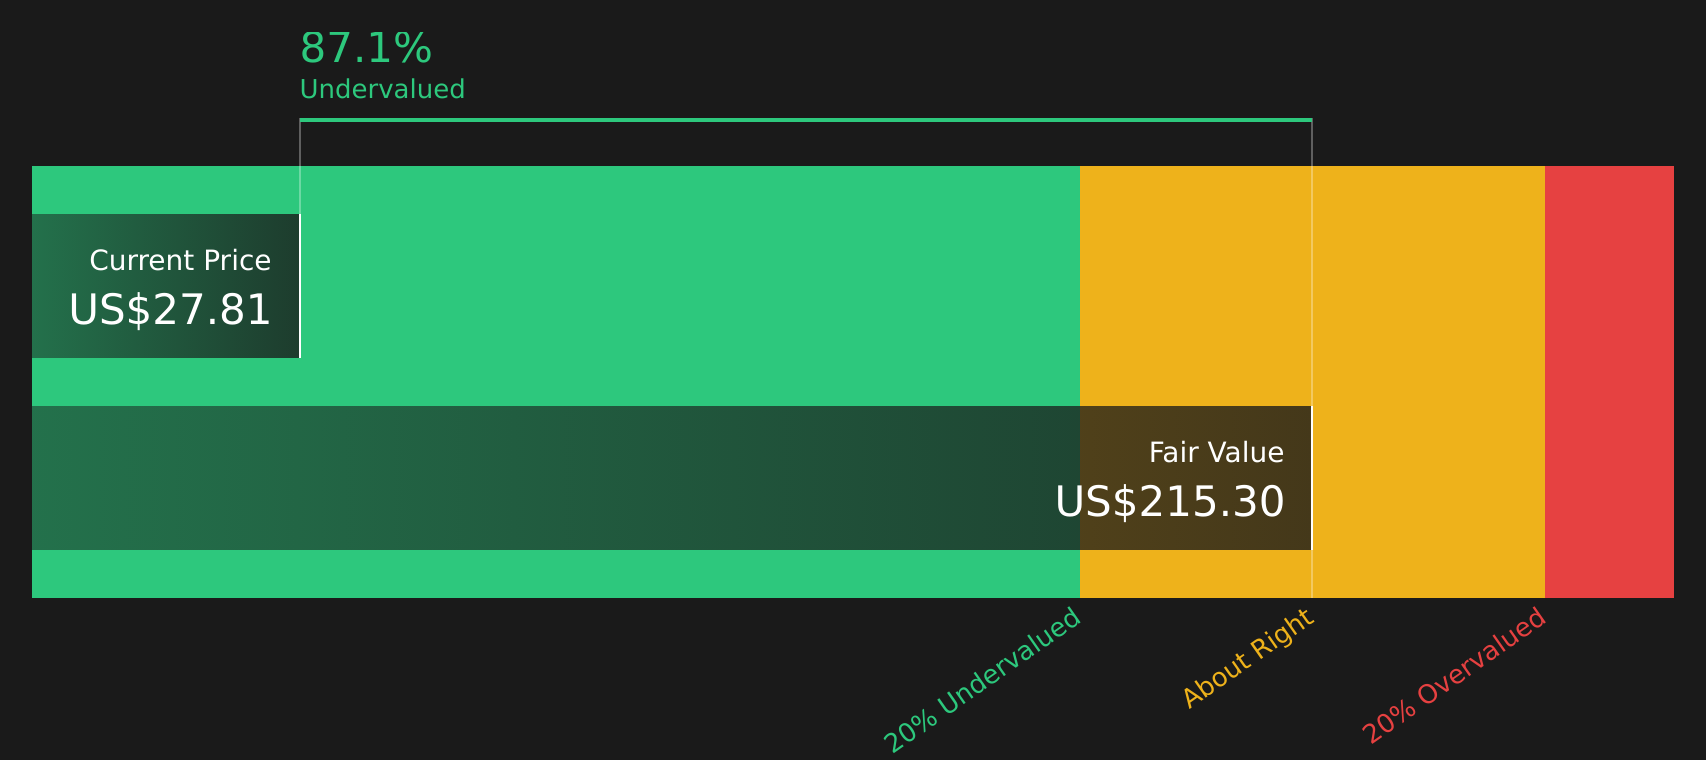
The fair value narrative pegs SM Energy at $28.82 and labels the stock as overvalued, yet our DCF model points in the opposite direction, with an estimated future cash flow value of $214.42 per share. That gap is wide, so which story do you think comes closer to reality for you as an investor?
To see how the SWS DCF model pieces this together and where the assumptions differ from the narrative above, take a closer look at the full calculation and inputs in our valuation breakdown, starting with the Look into how the SWS DCF model arrives at its fair value.
Simply Wall St performs a discounted cash flow (DCF) on every stock in the world every day (check out SM Energy for example). We show the entire calculation in full. You can track the result in your watchlist or portfolio and be alerted when this changes, or use our stock screener to discover 44 high quality undervalued stocks. If you save a screener we even alert you when new companies match - so you never miss a potential opportunity.
Next Steps
With mixed signals across valuation methods and sentiment, this is a moment to move quickly, review the full picture and weigh both the 3 key rewards and 5 important warning signs
Looking for more investment ideas?
If SM Energy has you thinking about what else could fit your portfolio, this is the moment to widen the net and see what the data is already surfacing.
- Spot potential value opportunities early by scanning the 44 high quality undervalued stocks before the crowd catches up.
- Strengthen the quality of your watchlist by focusing on companies in the solid balance sheet and fundamentals stocks screener (48 results) that may better handle tougher conditions.
- Add some fresh, off-the-radar prospects by checking the screener containing 20 high quality undiscovered gems so you are not only looking where everyone else is.
This article by Simply Wall St is general in nature. We provide commentary based on historical data and analyst forecasts only using an unbiased methodology and our articles are not intended to be financial advice. It does not constitute a recommendation to buy or sell any stock, and does not take account of your objectives, or your financial situation. We aim to bring you long-term focused analysis driven by fundamental data. Note that our analysis may not factor in the latest price-sensitive company announcements or qualitative material. Simply Wall St has no position in any stocks mentioned.