Stanley Black & Decker (SWK) Stock After 29% One-Year Rebound Is There More Upside
Stanley Black & Decker, Inc. SWK | 0.00 |
- For investors wondering whether Stanley Black & Decker at around US$83 per share offers good value or whether the easy gains are already behind it, this article breaks down what that price might really imply.
- The stock has returned 4.8% over the past week, 5.4% over the last month, and 8.7% year to date. Over longer periods, the 1 year return of 28.9% contrasts with a 3 year return of 2.5%, and over 5 years the share price declined 49.1%.
- Recent price moves are set against ongoing market attention on industrial and construction activity in the US and abroad. Investors are weighing how demand for tools and equipment might affect Stanley Black & Decker. Broader discussions around interest rates, housing activity and manufacturing trends also help frame how investors think about the stock's risk and reward trade off.
- Stanley Black & Decker currently has a valuation score of 3/6, based on being assessed as undervalued on 3 of 6 checks. The next sections will walk through the main valuation approaches investors often use, and will also point to a more complete way to think about value at the end of the article.
Approach 1: Stanley Black & Decker Discounted Cash Flow (DCF) Analysis
A Discounted Cash Flow model projects a company’s future cash flows and then discounts them back to today’s value, aiming to estimate what the business might be worth based on those cash flows.
For Stanley Black & Decker, the model used is a 2 Stage Free Cash Flow to Equity approach. The latest twelve month free cash flow is about $683.5 million. Analyst inputs and extrapolated estimates suggest free cash flow reaching about $1.17 billion in 2029, with intermediary projections between 2026 and 2035 ranging from roughly $784.3 million to $1.65 billion, all in $ terms. Simply Wall St only uses direct analyst forecasts for the nearer years and then extends the trend further out.
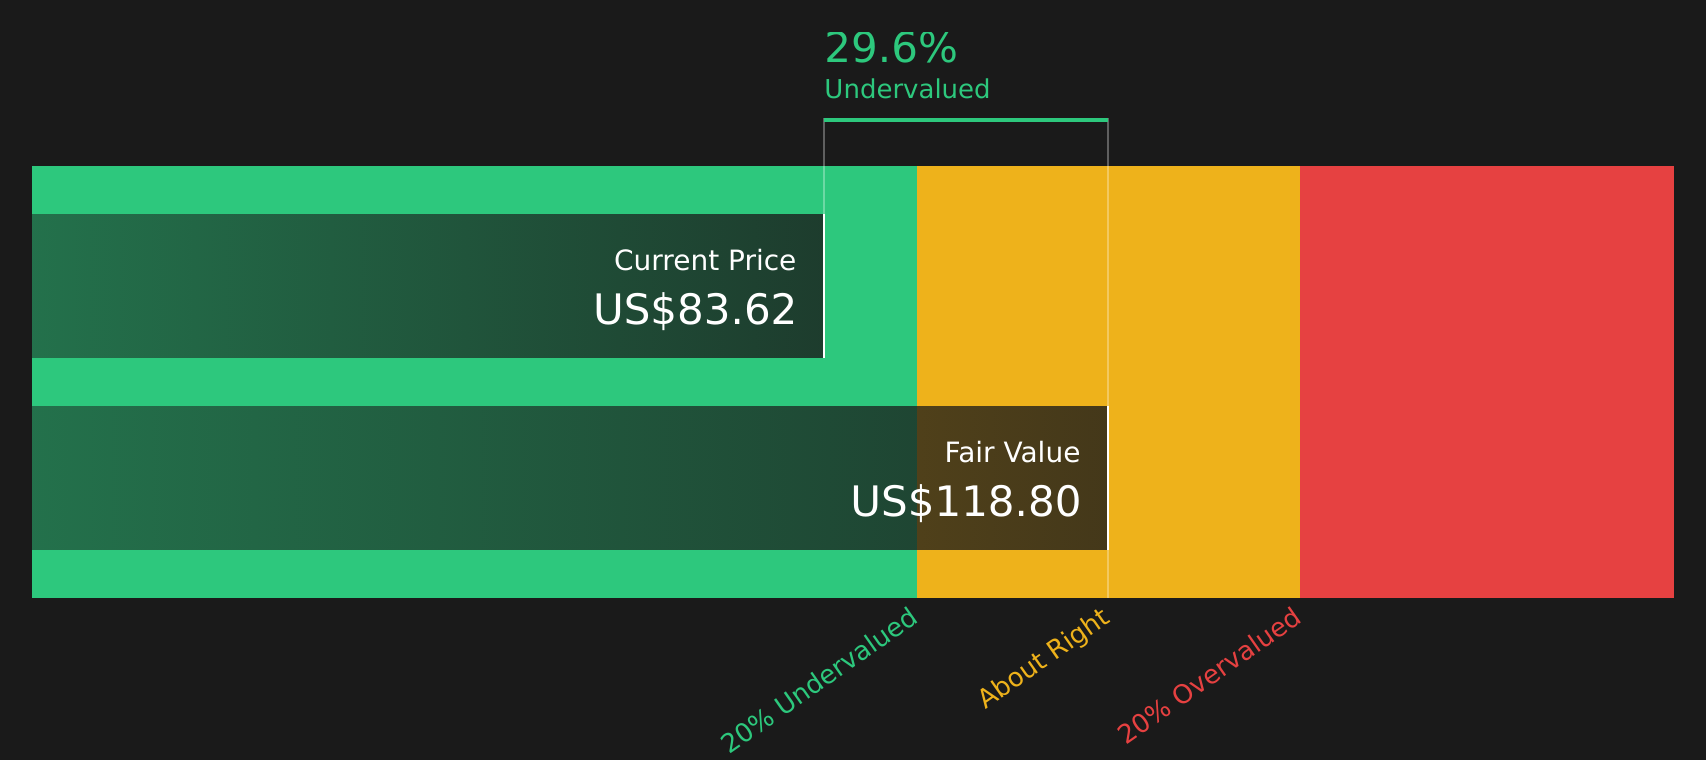
When all these projected cash flows are discounted back, the model arrives at an estimated intrinsic value of about $117.40 per share. Compared with the current share price around $83, this implies the stock is assessed as 29.2% undervalued by this DCF model.
Result: UNDERVALUED
Our Discounted Cash Flow (DCF) analysis suggests Stanley Black & Decker is undervalued by 29.2%. Track this in your watchlist or portfolio, or discover 46 more high quality undervalued stocks.
Approach 2: Stanley Black & Decker Price vs Earnings
For a profitable business, the P/E ratio is a useful way to gauge how much you are paying for each dollar of earnings, because it links today’s share price directly to the company’s current profit base.
What counts as a “normal” or “fair” P/E depends on how investors see the company’s growth potential and risk. Higher expected growth or lower perceived risk can support a higher P/E, while slower growth or higher risk usually points to a lower, more cautious multiple.
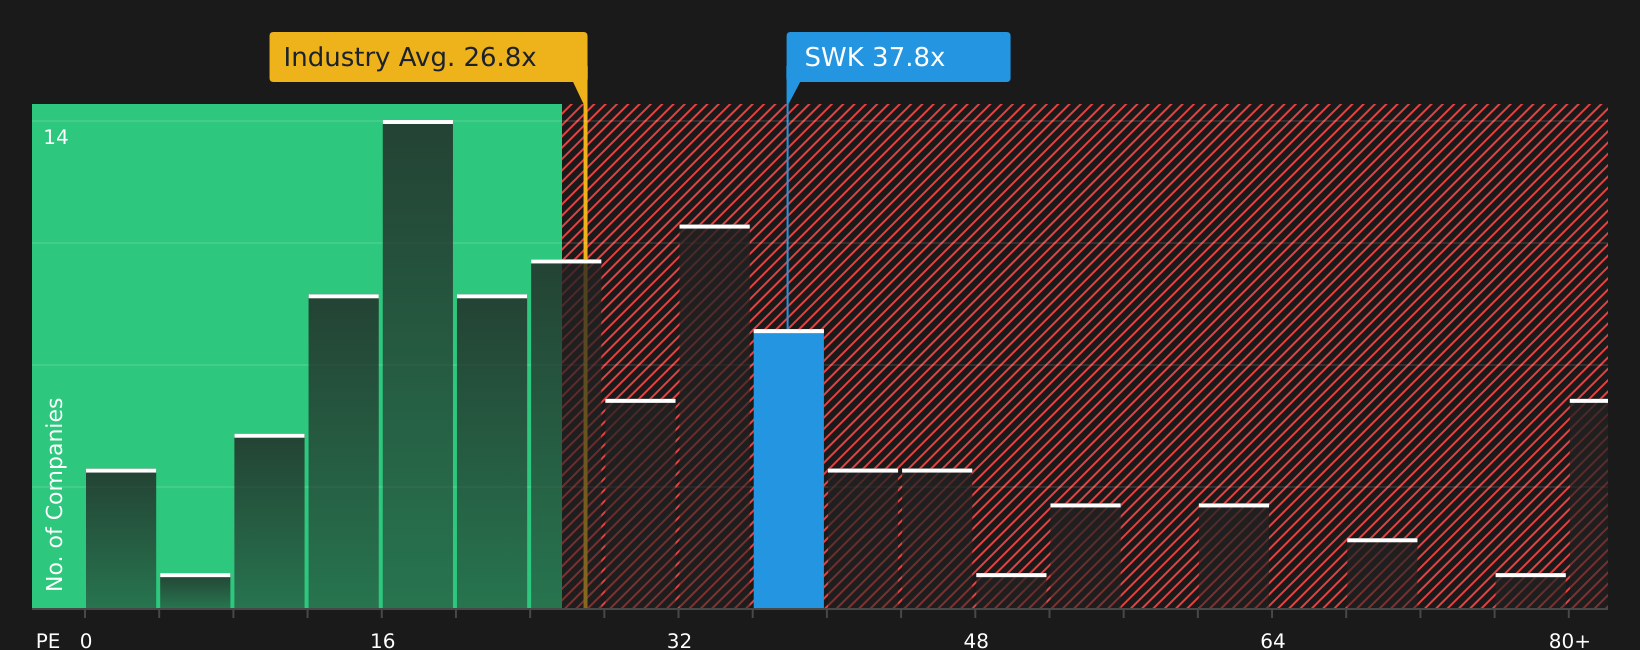
Stanley Black & Decker currently trades on a P/E of 34.82x. This sits above both the Machinery industry average P/E of 26.93x and the peer average of 24.73x. Simply Wall St’s Fair Ratio for the stock is 38.28x, which is its proprietary estimate of an appropriate P/E given factors such as earnings growth profile, industry, profit margins, market cap and company specific risks.
The Fair Ratio aims to be more tailored than a simple comparison with industry or peer averages, because it incorporates those additional company specific drivers rather than assuming one size fits all.
Comparing the current P/E of 34.82x with the Fair Ratio of 38.28x suggests the stock is assessed as undervalued on this measure.
Result: UNDERVALUED
Wall Street's queuing for one rocket. While SpaceX counts down to its IPO, other companies tied to the new space race are already in orbit. → 20 Compelling Space Companies watchlist · Global Space Race Investing Ideas screener · Scan the sector by valuation on Rocket Lab's valuation page.
Upgrade Your Decision Making: Choose your Stanley Black & Decker Narrative
Earlier it was mentioned that there is an even better way to understand valuation, and Narratives are that tool. They let you set out a clear story for Stanley Black & Decker, link it to specific forecasts for revenue, earnings and margins, and then see the fair value that falls out of those assumptions alongside the current price.
On Simply Wall St’s Community page, Narratives are available to millions of investors as an easy way to connect a qualitative view with hard numbers. You can see, for example, how a more cautious view that supports a fair value around US$75 fits next to a more optimistic view closer to US$116.82, and decide what those different stories might mean for your own timing decisions.
Because Narratives update automatically when fresh information such as earnings, guidance or news is added to the platform, your Stanley Black & Decker view does not stay static. It evolves as the facts change, which helps you keep your decisions anchored to a clear, up to date story rather than just reacting to short term price moves.
For Stanley Black & Decker, however, we will make it really easy for you with previews of two leading Stanley Black & Decker Narratives:
Fair value in this optimistic narrative: US$116.82 per share
Gap between this fair value and the last close around US$83.13: roughly 29% below that narrative fair value
Revenue growth assumption used in this view: about 2.10% a year
- Focuses on cost savings and operational efficiencies that analysts expect to support higher margins and a higher earnings base over time.
- Sees opportunities in pro focused tools, digital solutions and connected products, alongside broader home improvement and urbanization trends.
- Highlights risks from changing consumer preferences, competition and acquisition related debt, and encourages you to test whether the bullish revenue and margin forecasts feel realistic.
Fair value in this cautious narrative: US$75.00 per share
Gap between this fair value and the last close around US$83.13: roughly 10% above that narrative fair value
Revenue growth assumption used in this view: about 1.52% a year
- Emphasizes demographic shifts, changing consumer preferences and rising competition that could weigh on long term demand and earnings stability.
- Flags structural cost pressures from supply chain, legacy obligations and commoditization as potential headwinds for margins and returns.
- Still acknowledges progress on streamlining operations and brand investment, but applies a lower P/E and more restrained fair value, asking you to consider whether a more conservative stance fits your own expectations.
Once you have a sense of which story feels closer to your own view, you can use the full Community Narratives and valuation tools to stress test your assumptions, adjust the revenue and margin paths, and see how that changes fair value and the risk reward trade off for your portfolio.
Do you think there's more to the story for Stanley Black & Decker? Head over to our Community to see what others are saying!

This article by Simply Wall St is general in nature. We provide commentary based on historical data and analyst forecasts only using an unbiased methodology and our articles are not intended to be financial advice. It does not constitute a recommendation to buy or sell any stock, and does not take account of your objectives, or your financial situation. We aim to bring you long-term focused analysis driven by fundamental data. Note that our analysis may not factor in the latest price-sensitive company announcements or qualitative material. Simply Wall St has no position in any stocks mentioned.