

Stronger Q2 Profitability and Cash Distribution Could Be A Game Changer For Cheniere Partners (CQP)
Cheniere Energy Partners, L.P. CQP | 0.00 |
- Cheniere Energy Partners, L.P. recently reported past second‑quarter 2026 results, with revenue rising to US$2,583 million and net income to US$1,161 million, alongside higher earnings per unit, and also affirmed a total cash distribution of US$0.820 per common unit payable in August 2026.
- The sharp increase in quarterly net income compared with the prior year highlights a substantial improvement in profitability, reinforcing the importance of its liquefied natural gas export operations for overall financial performance.
- Next, we’ll examine how this stronger profitability profile, highlighted by the higher quarterly net income, shapes Cheniere Energy Partners’ broader investment narrative.
AI is about to change healthcare. These 43 stocks are working on everything from early diagnostics to drug discovery. The best part - they are all under $10b in market cap - there's still time to get in early.
What Is Cheniere Energy Partners' Investment Narrative?
To own Cheniere Energy Partners, you really have to believe in the durability of its liquefied natural gas export footprint and the cash it can throw off even as growth expectations cool. The latest quarter’s jump in net income to US$1,161 million, with only a modest revenue move, reinforces that the Sabine Pass complex can be very profitable when conditions line up, and the maintained cash distribution of US$0.820 per unit underlines how central payouts remain to the story. In the short term, that stronger profitability may ease some concern around its high debt load and the guidance for relatively flat distributions, but it does not erase the bigger catalysts and risks: contract renewals, refinancing terms on its new long‑dated notes, and forecasts for declining earnings. This earnings beat simply gives the partnership a bit more breathing room as those issues play out.
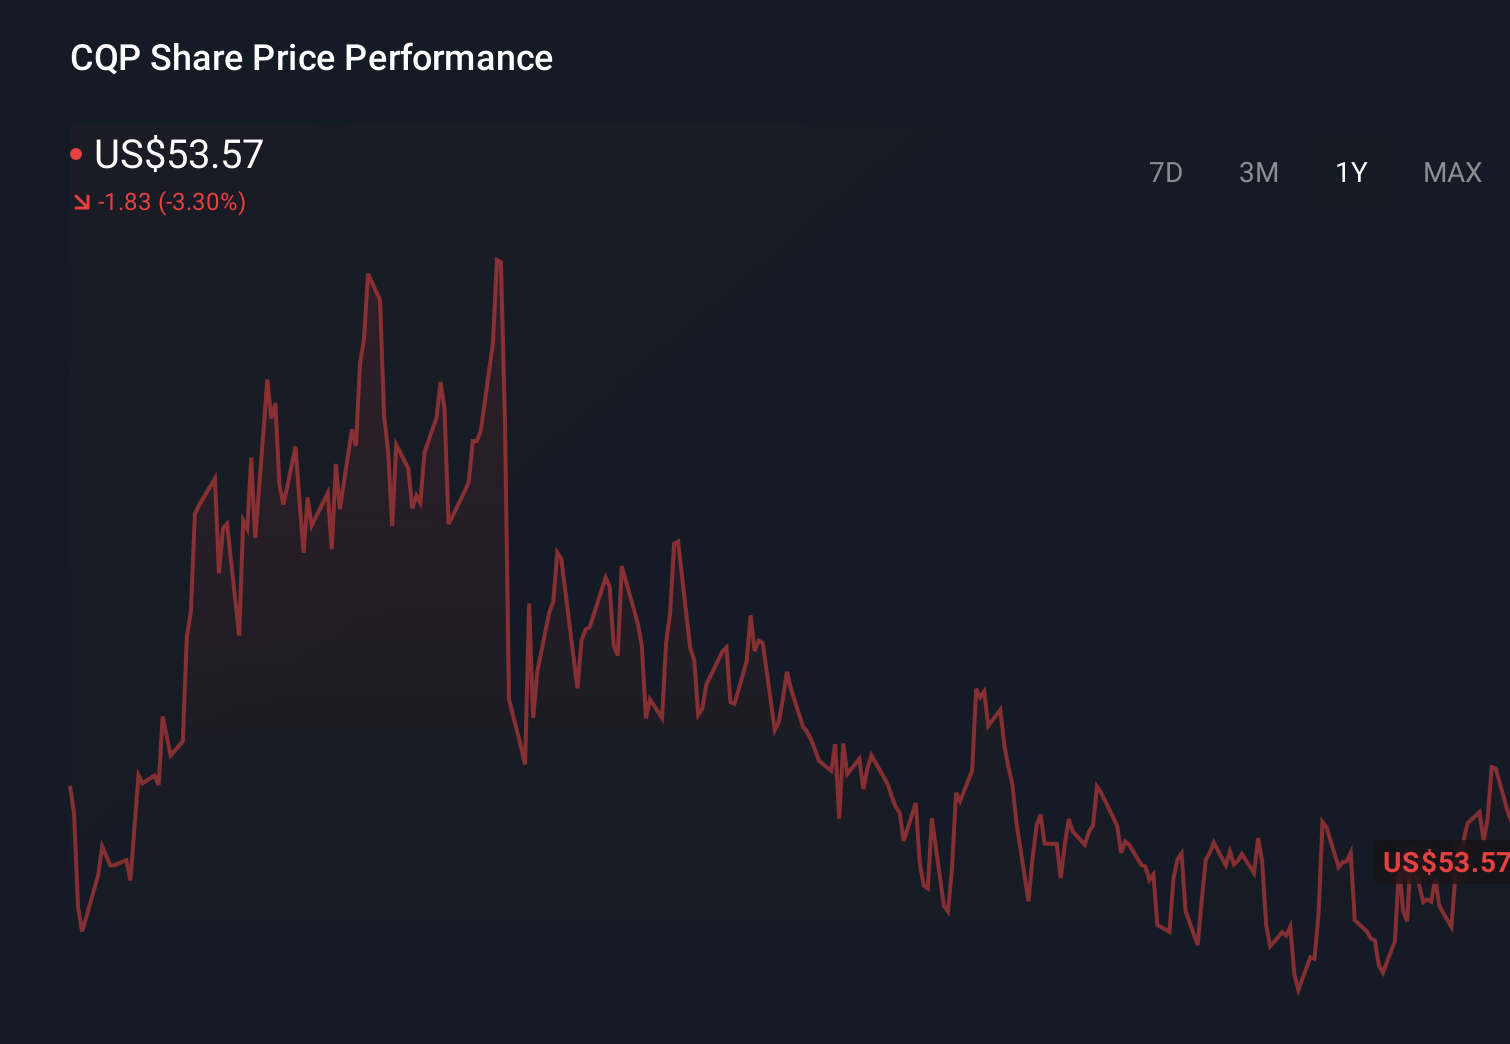
However, investors also need to weigh how that high debt level could limit flexibility. Cheniere Energy Partners' share price has been on the slide but might be dropping deeper into value territory. Find out whether it's a bargain at this price.Exploring Other Perspectives
Explore 2 other fair value estimates on Cheniere Energy Partners - why the stock might be worth less than half the current price!
Form Your Own Verdict
Disagree with this assessment? Extraordinary investment returns rarely come from following the herd, so go with your instincts.
- A great starting point for your Cheniere Energy Partners research is our analysis highlighting 3 key rewards and 3 important warning signs that could impact your investment decision.
- Our free Cheniere Energy Partners research report provides a comprehensive fundamental analysis summarized in a single visual - the Snowflake - making it easy to evaluate Cheniere Energy Partners' overall financial health at a glance.
Want Some Alternatives?
Every day counts. These free picks are already gaining attention. See them before the crowd does:
- This technology could replace computers: discover 26 stocks that are working to make quantum computing a reality.
- The best AI stocks today may lie beyond giants like Nvidia and Microsoft. Find the next big opportunity with these 17 smaller AI-focused companies with strong growth potential through early-stage innovation in machine learning, automation, and data intelligence that could fund your retirement.
- Find 52 companies with promising cash flow potential yet trading below their fair value.
This article by Simply Wall St is general in nature. We provide commentary based on historical data and analyst forecasts only using an unbiased methodology and our articles are not intended to be financial advice. It does not constitute a recommendation to buy or sell any stock, and does not take account of your objectives, or your financial situation. We aim to bring you long-term focused analysis driven by fundamental data. Note that our analysis may not factor in the latest price-sensitive company announcements or qualitative material. Simply Wall St has no position in any stocks mentioned.