TechnipFMC (FTI) Valuation Check After Earnings Beat Margins Strength And Capital Returns
TechnipFMC plc FTI | 0.00 |
Why TechnipFMC’s latest quarter is on investors’ radar
TechnipFMC (FTI) just reported first quarter 2026 results with non GAAP earnings and EBITDA margins ahead of expectations, a small revenue miss, and further capital returns through buybacks and dividends, putting the stock back in focus.
At a share price of $75.03, TechnipFMC has a 90 day share price return of 32.7% and a year to date share price return of 58.6%, while the 5 year total shareholder return is very large, suggesting momentum has been strong over both shorter and longer periods.
Part of that interest tracks recent events, including Q1 earnings where adjusted profitability and EBITDA margins exceeded expectations, continued buybacks that have retired 16.34% of shares since 2022, and a reaffirmed quarterly dividend. Taken together, these developments indicate how management is currently balancing growth projects with capital returns.
If TechnipFMC’s run has you thinking about where else capital expenditure and infrastructure themes might show up, this could be a good moment to scan 35 power grid technology and infrastructure stocks
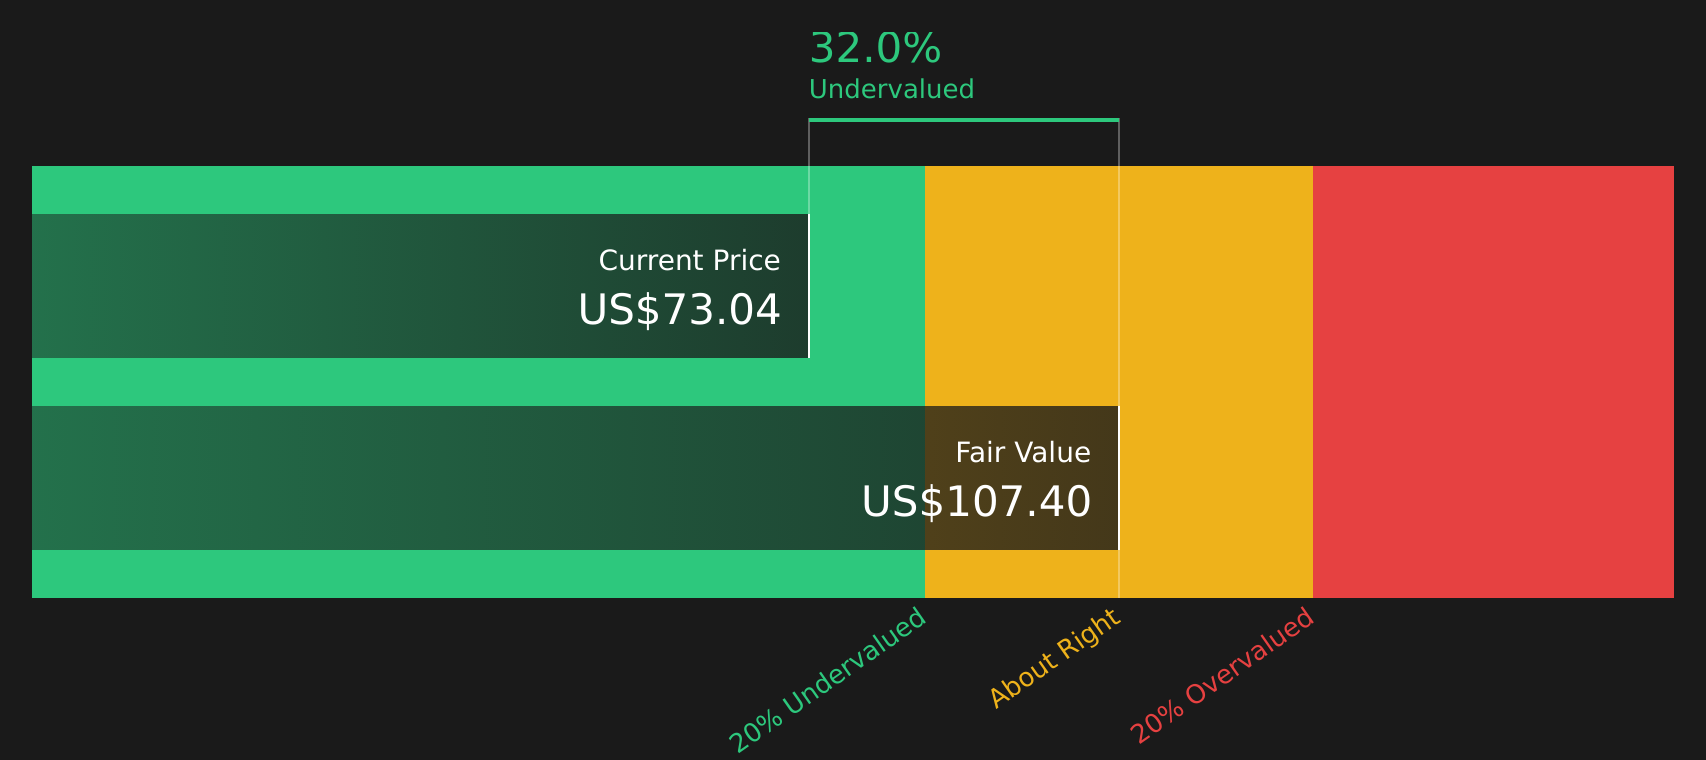
With the stock up sharply and trading slightly above the average analyst price target, yet with an indicated 28.2% intrinsic discount, investors are left with a key question: is there still a buying opportunity here, or is the market already pricing in future growth?
Most Popular Narrative: 14.3% Overvalued
Analysts see fair value for TechnipFMC at $65.62 versus the current $75.03 share price, so the prevailing narrative leans toward rich pricing on updated assumptions.
Robust and growing pipeline of offshore oil & gas and deepwater projects globally, driven by increased capital allocation to longer-cycle offshore developments in regions such as Brazil, Guyana, Mozambique, and Namibia, is underpinning TechnipFMC's record Subsea order intake and high backlog, supporting visibility into sustained revenue growth over the coming years.
Curious what revenue path, margin lift and future earnings multiple need to line up to defend that fair value cut below today’s price? The narrative presents a detailed growth runway, a higher profitability profile and a reset valuation framework built on a specific discount rate and a multi year earnings bridge.
Result: Fair Value of $65.62 (OVERVALUED)
However, there is still real execution risk arising from exposure to geopolitically sensitive projects and from the pace of any shift away from traditional oil and gas spending.
Another Take on Value: Cash Flows Point the Other Way
While analyst targets suggest TechnipFMC is 14.3% overvalued at $75.03 versus a $65.62 fair value, the SWS DCF model tells a different story. On that view, the stock trades at a 28.2% discount to an estimated future cash flow value of $104.50. The question is which lens you trust more.
Simply Wall St performs a discounted cash flow (DCF) on every stock in the world every day (check out TechnipFMC for example). We show the entire calculation in full. You can track the result in your watchlist or portfolio and be alerted when this changes, or use our stock screener to discover 51 high quality undervalued stocks. If you save a screener we even alert you when new companies match - so you never miss a potential opportunity.
Next Steps
With mixed signals on value and sentiment, are you leaning bullish or cautious on TechnipFMC right now? Act while the data is fresh and weigh the potential upside and risks by reviewing the 3 key rewards
Looking for more investment ideas?
If TechnipFMC has sharpened your interest, do not stop here. Broaden your watchlist now so you are not late to the next opportunity.
- Target resilience by scanning companies that combine healthy finances with staying power through the solid balance sheet and fundamentals stocks screener (46 results).
- Hunt for quality at a discount by reviewing the 51 high quality undervalued stocks before prices fully reflect their fundamentals.
- Lean toward steadier potential by checking out the 72 resilient stocks with low risk scores so sharp drawdowns do not catch you off guard.
This article by Simply Wall St is general in nature. We provide commentary based on historical data and analyst forecasts only using an unbiased methodology and our articles are not intended to be financial advice. It does not constitute a recommendation to buy or sell any stock, and does not take account of your objectives, or your financial situation. We aim to bring you long-term focused analysis driven by fundamental data. Note that our analysis may not factor in the latest price-sensitive company announcements or qualitative material. Simply Wall St has no position in any stocks mentioned.