TriMas (TRS) Stock Weighs Strong One-Year Rally Against Cash Flow Valuation Estimate
TriMas Corporation TRS | 0.00 |
How TriMas Stock Is Priced Today
TriMas is on many watchlists right now, and if you are asking whether the current share price properly reflects the business, you are not alone.
Recent returns give some context for that question, with the stock at US$44.58 and showing 1.9% over 7 days, 8.3% over 30 days, 22.8% year to date, 57.8% over 1 year, 65.0% over 3 years and 54.7% over 5 years.
Alongside these moves, investors have been watching company updates and broader sector headlines that help frame expectations around TriMas, including how it is positioned within its industry and any shifts in its operating focus. These items help explain why sentiment can change quickly, even when day to day price moves look modest.
Against that backdrop, TriMas currently scores 1 out of 6 on our valuation checks. This sets up a closer look at different valuation methods shortly, with an even more helpful way to think about fair value coming at the end of this article.
TriMas scores just 1/6 on our valuation checks. See what other red flags we found in the full valuation breakdown.
Approach 1: TriMas Discounted Cash Flow (DCF) Analysis
A Discounted Cash Flow, or DCF, model estimates what a company like TriMas could be worth by projecting its future cash flows and then discounting those back to today using a required rate of return. It is essentially asking what all those future dollars are worth in present terms.
For TriMas, the model used is a 2 Stage Free Cash Flow to Equity approach based on cash flow projections. The latest twelve month free cash flow is about $52.3 million. Simply Wall St then projects free cash flow out to 2035, with estimated free cash flow of $88.9 million in that year. Analysts typically only provide detailed estimates for up to 5 years, so the later projections are extrapolated from those earlier assumptions.
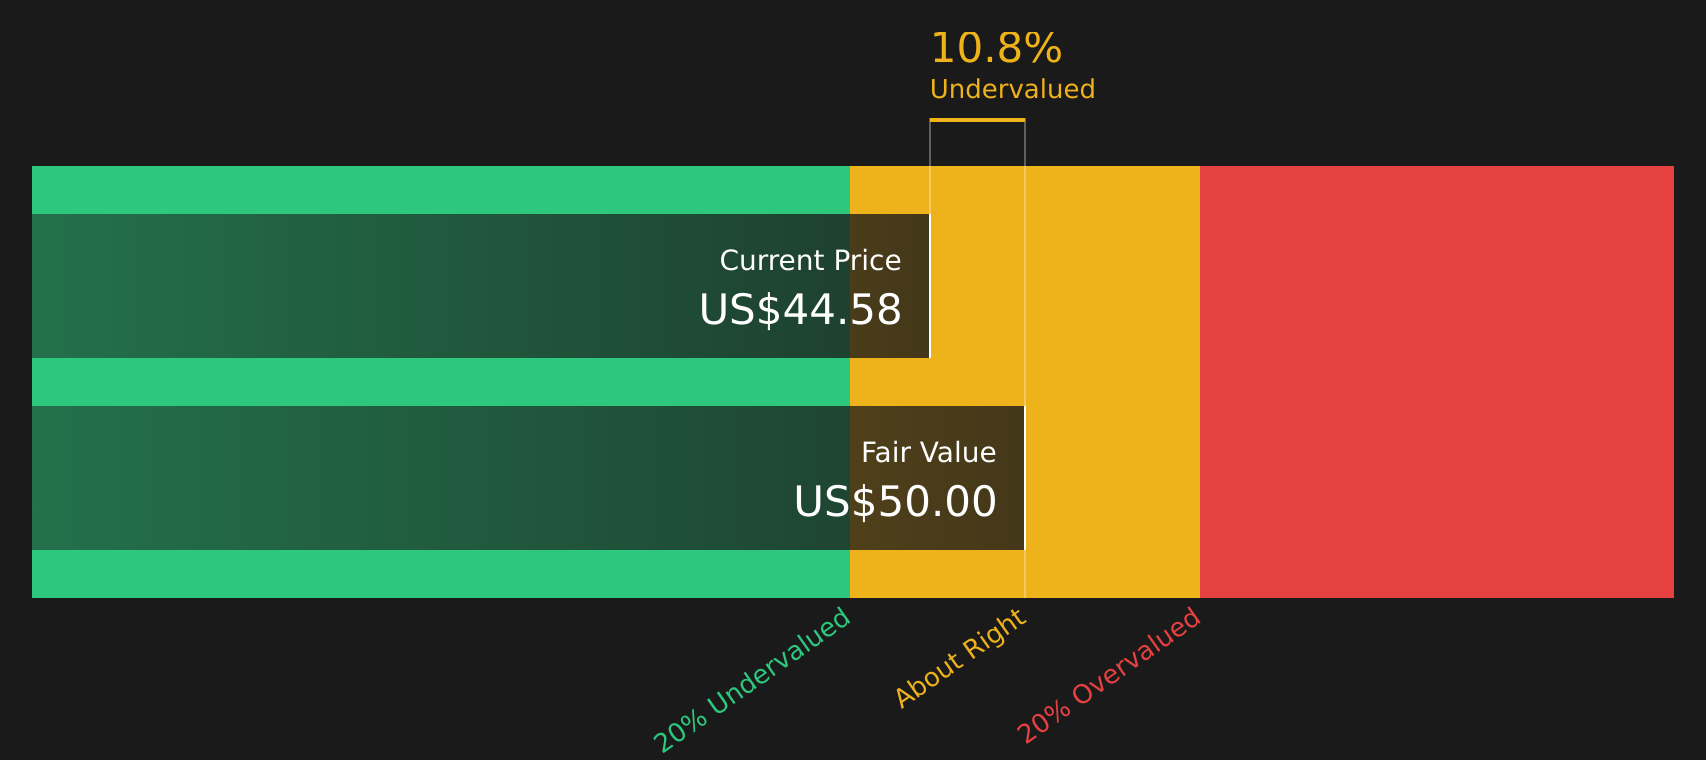
Adding up all discounted projected cash flows gives an estimated intrinsic value of about $49.97 per share. Compared with the current share price of $44.58, the DCF suggests TriMas stock trades at roughly a 10.8% discount, which may indicate a relatively favorable valuation for investors who rely on cash flow based analysis.
Result: UNDERVALUED
Our Discounted Cash Flow (DCF) analysis suggests TriMas is undervalued by 10.8%. Track this in your watchlist or portfolio, or discover 44 more high quality undervalued stocks.
Approach 2: TriMas Price vs Earnings
For profitable companies like TriMas, the P/E ratio is a commonly used gauge because it links what you pay for the stock to the earnings the business generates today. It helps you see how many dollars investors are currently willing to pay for each dollar of earnings.
What counts as a "normal" or "fair" P/E ratio often reflects growth expectations and risk. Higher expected earnings growth or lower perceived risk can support a higher P/E, while slower growth or higher risk can point to a lower P/E being more typical.
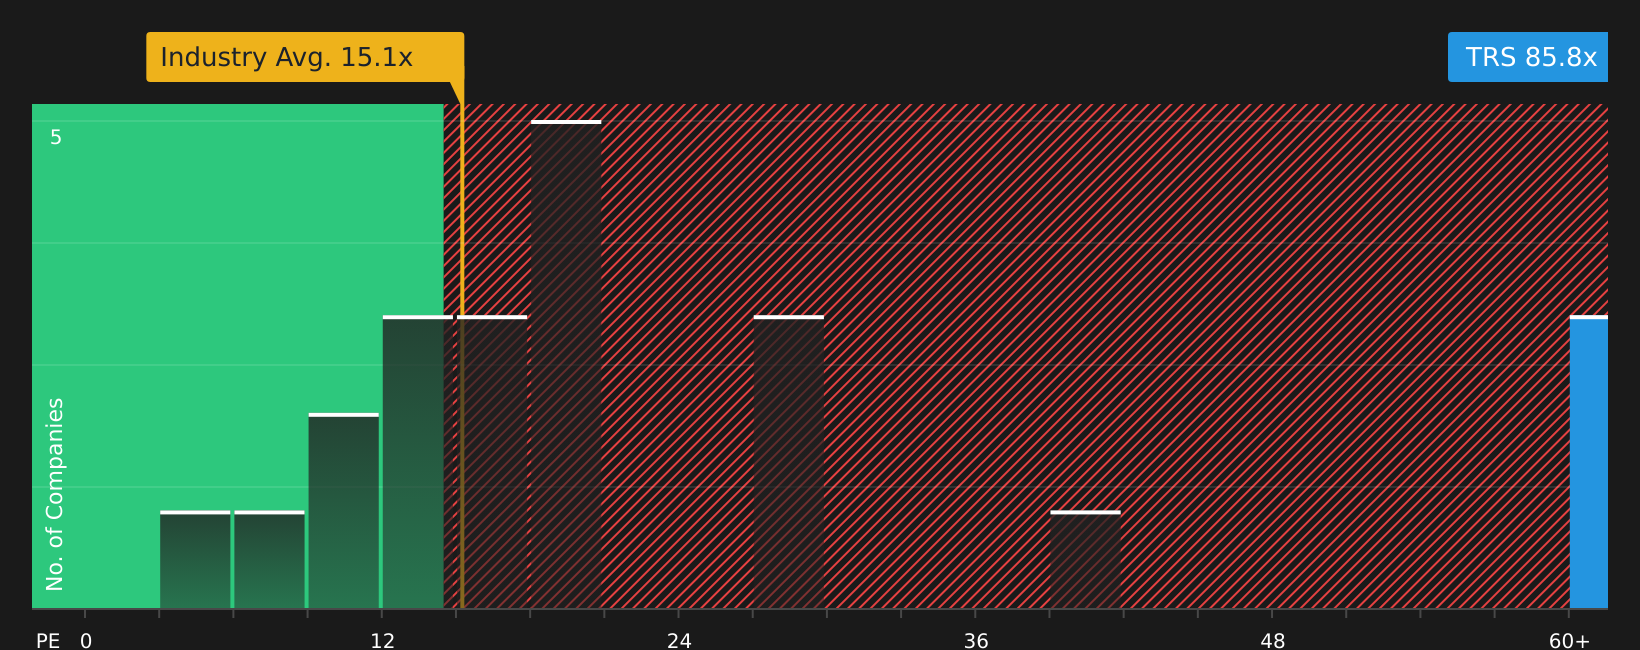
TriMas currently trades on a P/E of 85.82x, compared with an average of 21.56x for peers and 15.14x for the wider Packaging industry. Simply Wall St also calculates a proprietary Fair Ratio of 81.57x. This is the P/E level suggested by factors such as TriMas earnings growth profile, profit margins, industry, market cap and risk characteristics. Because this Fair Ratio adjusts for those elements, it can be more tailored than a simple comparison with peers or industry averages. Here, the current P/E of TriMas is above the Fair Ratio, which points to the stock looking overvalued on this metric.
Result: OVERVALUED
P/E ratios tell one story, but what if the real opportunity lies elsewhere? Start investing in legacies, not executives. Discover our 20 top founder-led companies.
Upgrade Your Decision Making: Choose your TriMas Narrative
Earlier the article mentioned that there is an even better way to understand valuation, and on Simply Wall St that takes the form of Narratives. In a Narrative, you set out your story for TriMas and connect it to specific assumptions for future revenue, earnings, margins and a fair value estimate. You can then compare that Fair Value with the current price to help you decide whether the stock looks attractive or stretched. The narrative and its numbers automatically update as new information such as earnings or news arrives. On the Community page, you might see one investor using the analyst consensus view that ties TriMas to a Fair Value of about US$45.00 based on revenue of US$747.8 million, earnings of US$77.9 million and a future P/E of 20.5x by 2029. Another investor could plug in more cautious or more optimistic assumptions to arrive at a meaningfully lower or higher Fair Value. This gives you a clear, story driven framework rather than a single number to react to.
Do you think there's more to the story for TriMas? Head over to our Community to see what others are saying!

This article by Simply Wall St is general in nature. We provide commentary based on historical data and analyst forecasts only using an unbiased methodology and our articles are not intended to be financial advice. It does not constitute a recommendation to buy or sell any stock, and does not take account of your objectives, or your financial situation. We aim to bring you long-term focused analysis driven by fundamental data. Note that our analysis may not factor in the latest price-sensitive company announcements or qualitative material. Simply Wall St has no position in any stocks mentioned.